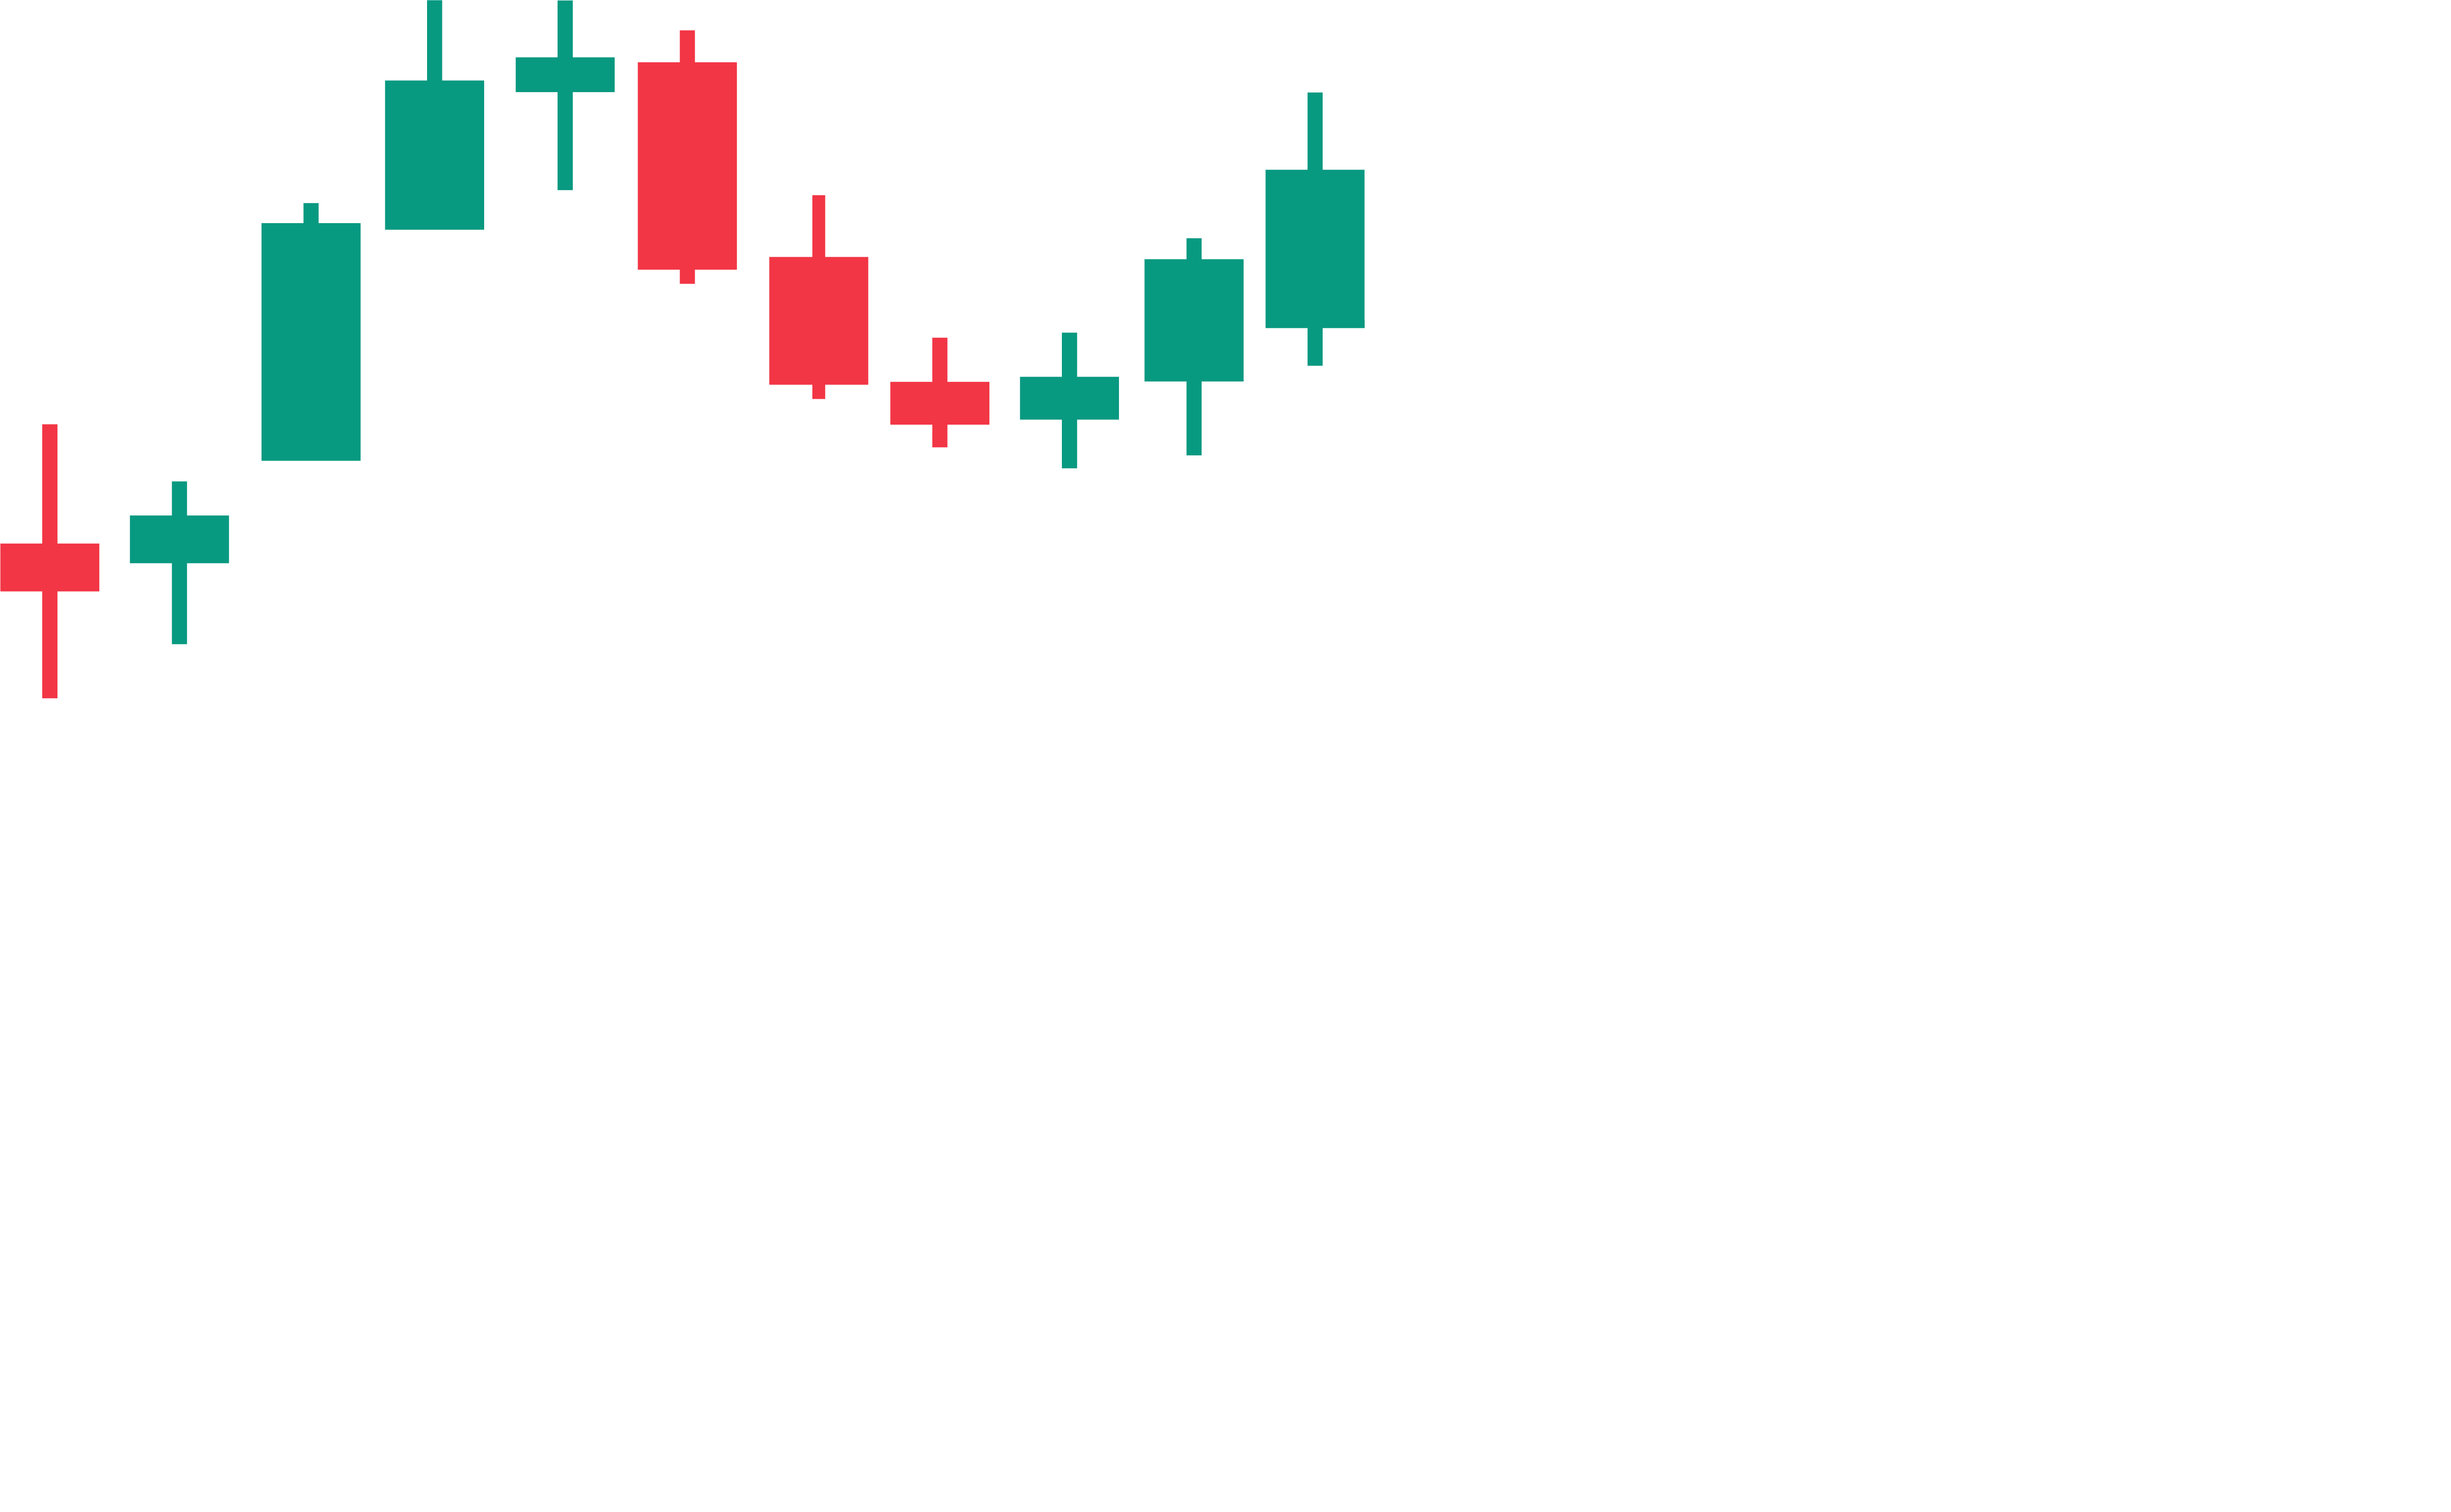
Stuck in chop? See the strikes price keeps pinning to
SPX chopped for a whole session and every breakout faded. Here is the gamma map that showed the range before the open, three checks to read it, and one real day the range did not hold.
25 posts · page 2 of 4
SPX chopped for a whole session and every breakout faded. Here is the gamma map that showed the range before the open, three checks to read it, and one real day the range did not hold.

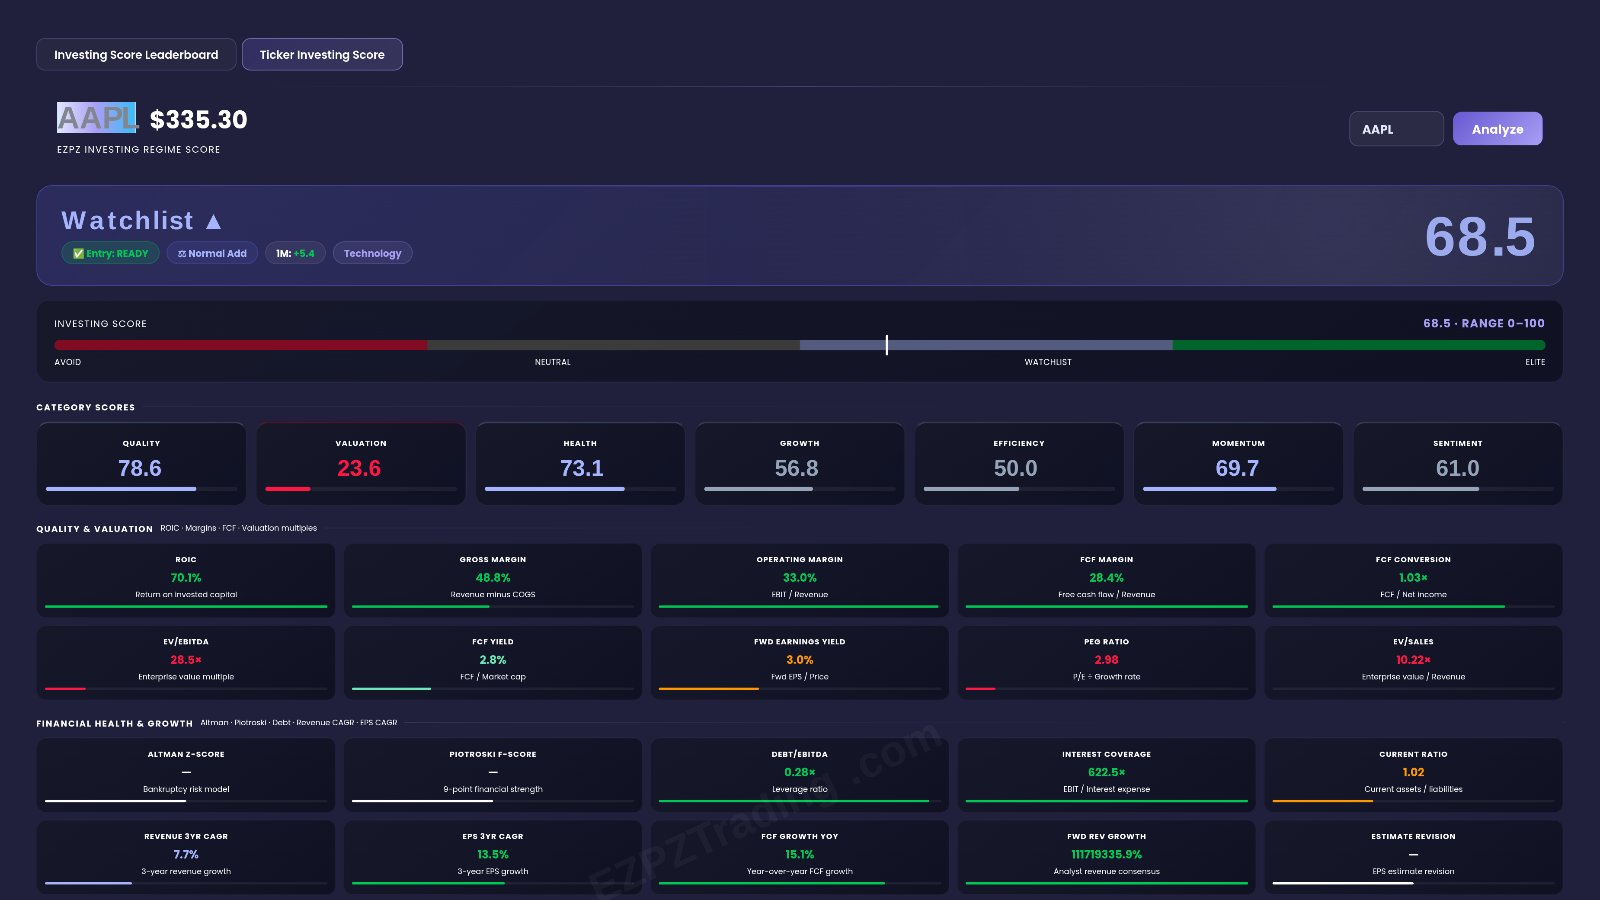
AAPL scores 68.5 on the Ticker Investing Score, sits in the WATCHLIST zone and shows Entry: READY with a Normal Add. Here is how to read every panel, from the seven category scores to the drivers and detractors.

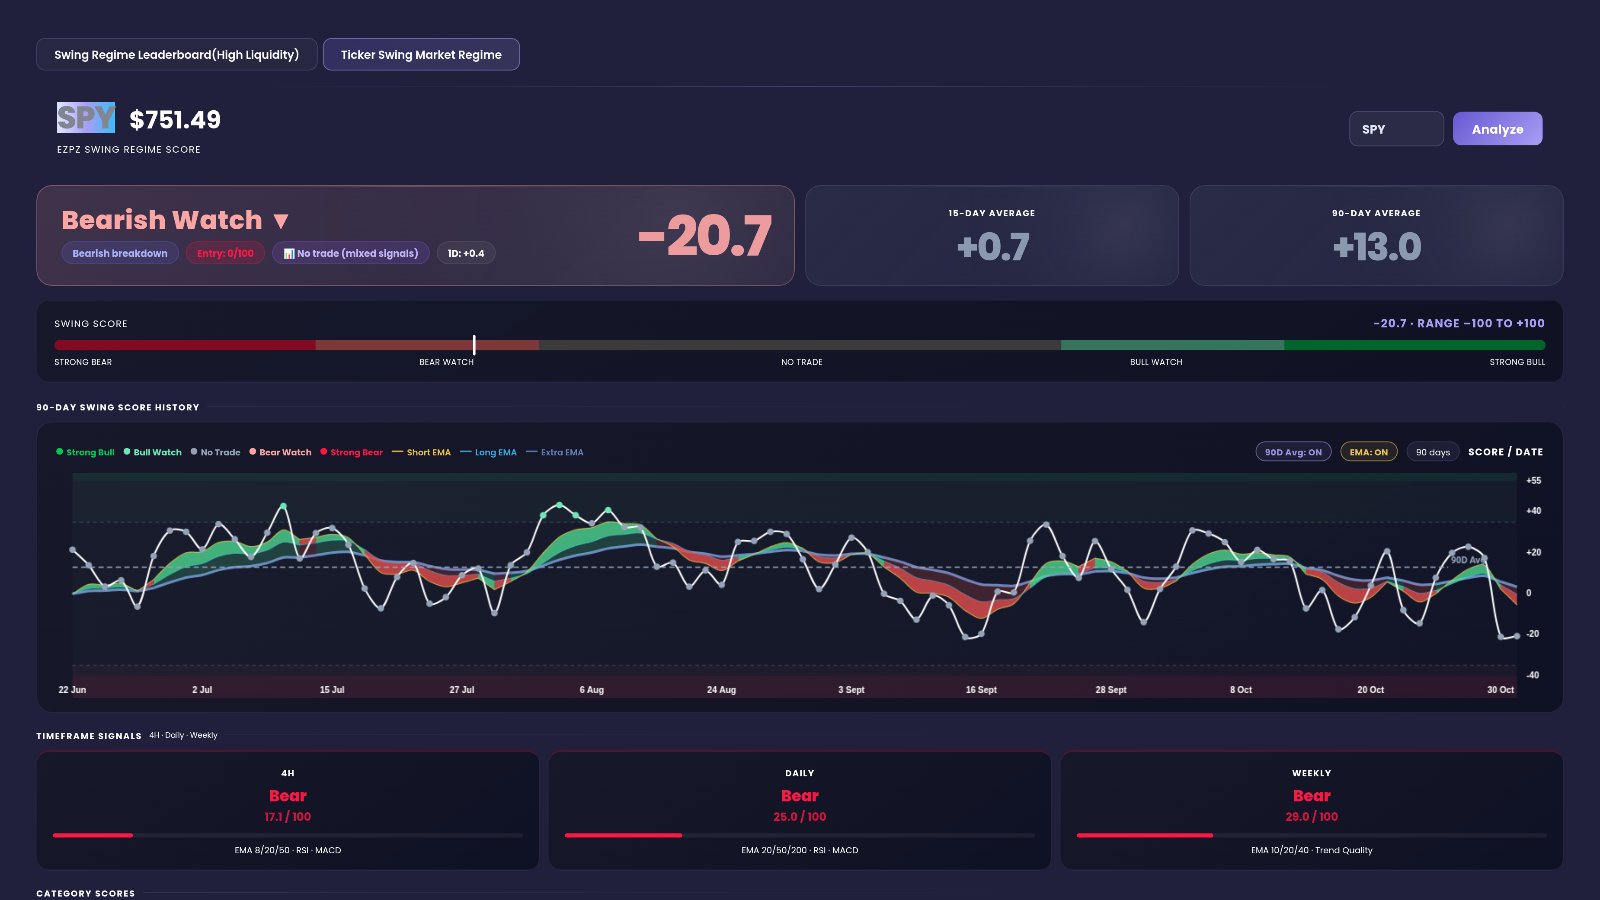
On November 2, 2026, SPY's swing score sat at -20.7, a Bearish Watch reading with Entry Quality 0/100 and all three timeframes labeled Bear. Here is how to read every panel of the Ticker Swing Market Regime page.

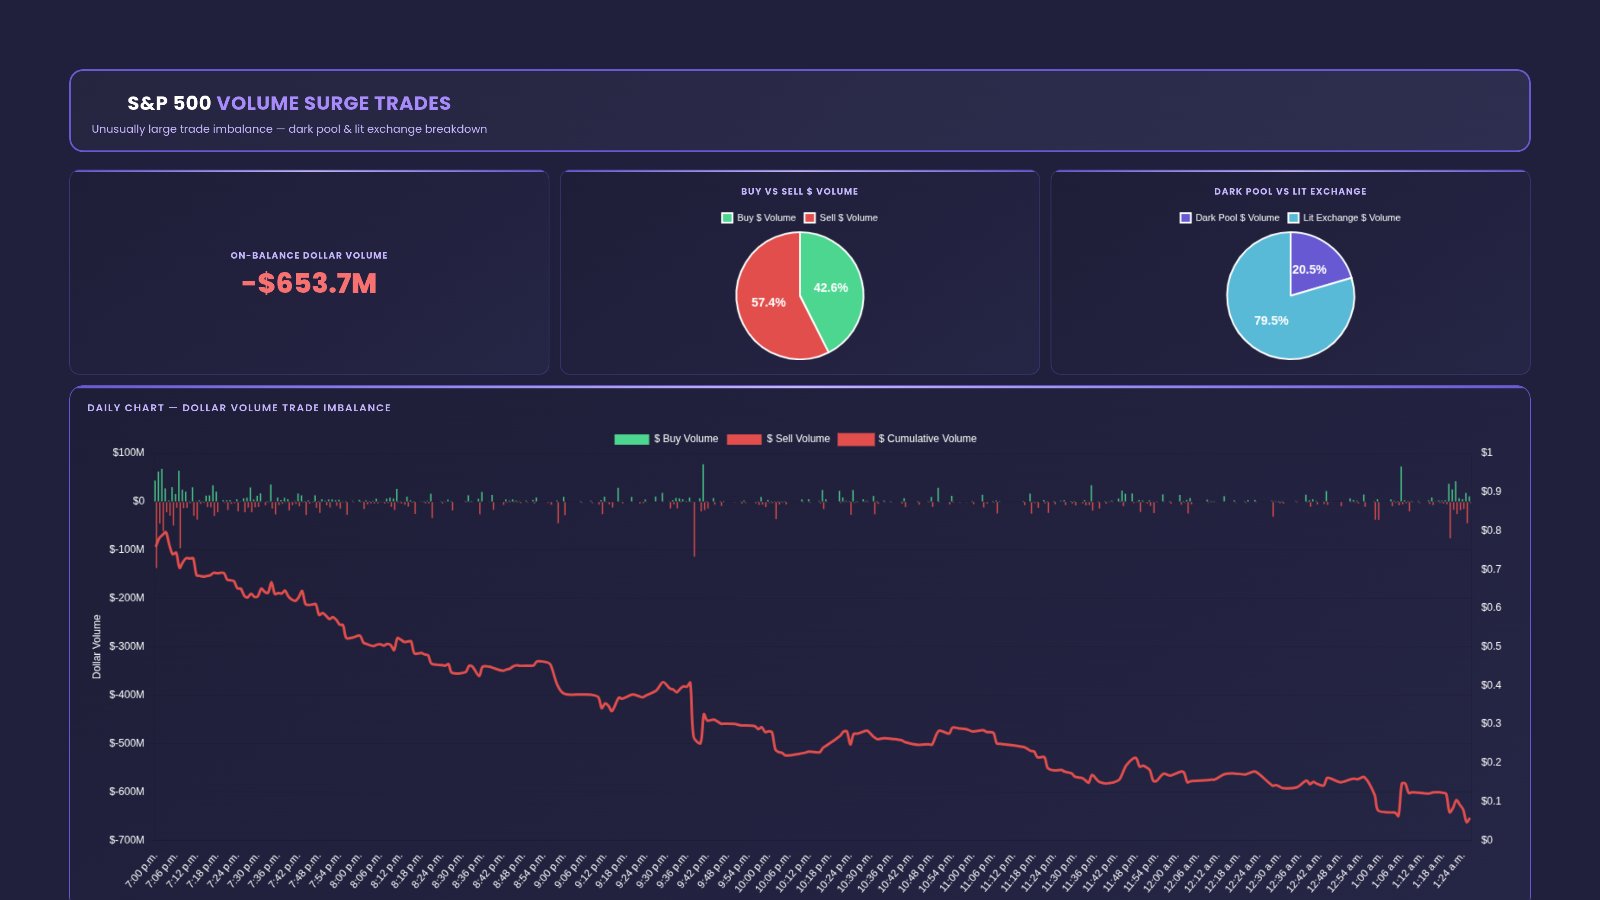
In the latest data, S&P 500 volume surge trades show -$653.7M on-balance dollar volume. Technology leads the selling at -352.7M, Financials lean buy at 144.3M, and NVDA sits in the Top Sell Imbalance table while AAPL shows up on the buy side.

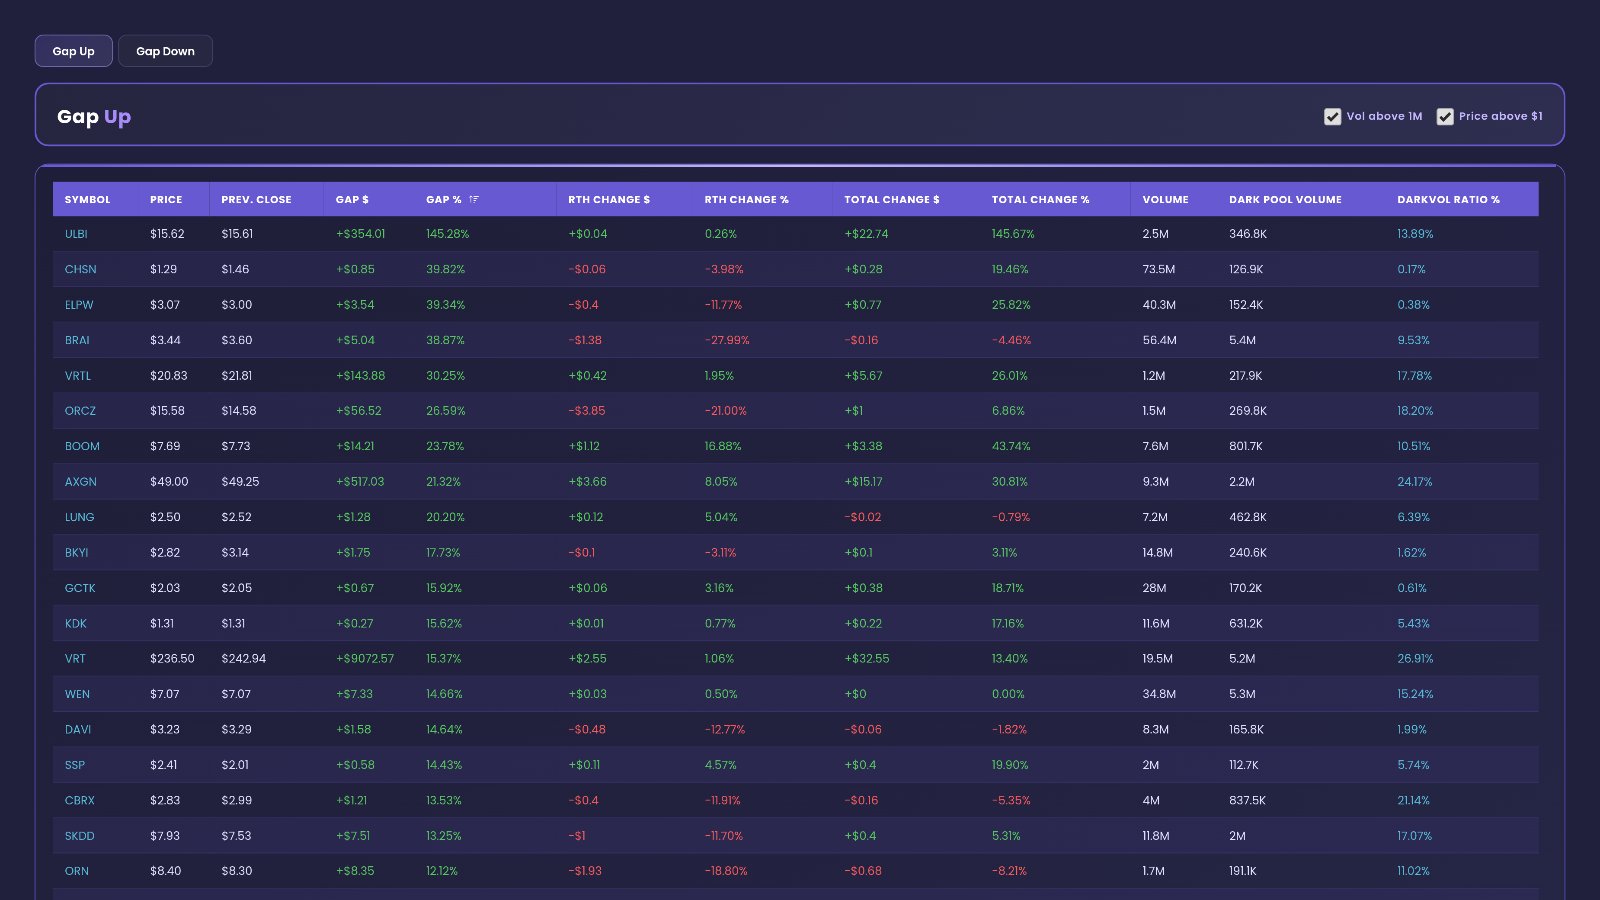
In the latest data, AXGN gapped up +21.32% and kept running to +30.81% total, while VRT gapped +15.37% with a 26.9% DarkVol ratio. Here is how to read every column of the Gap Up Scanner.

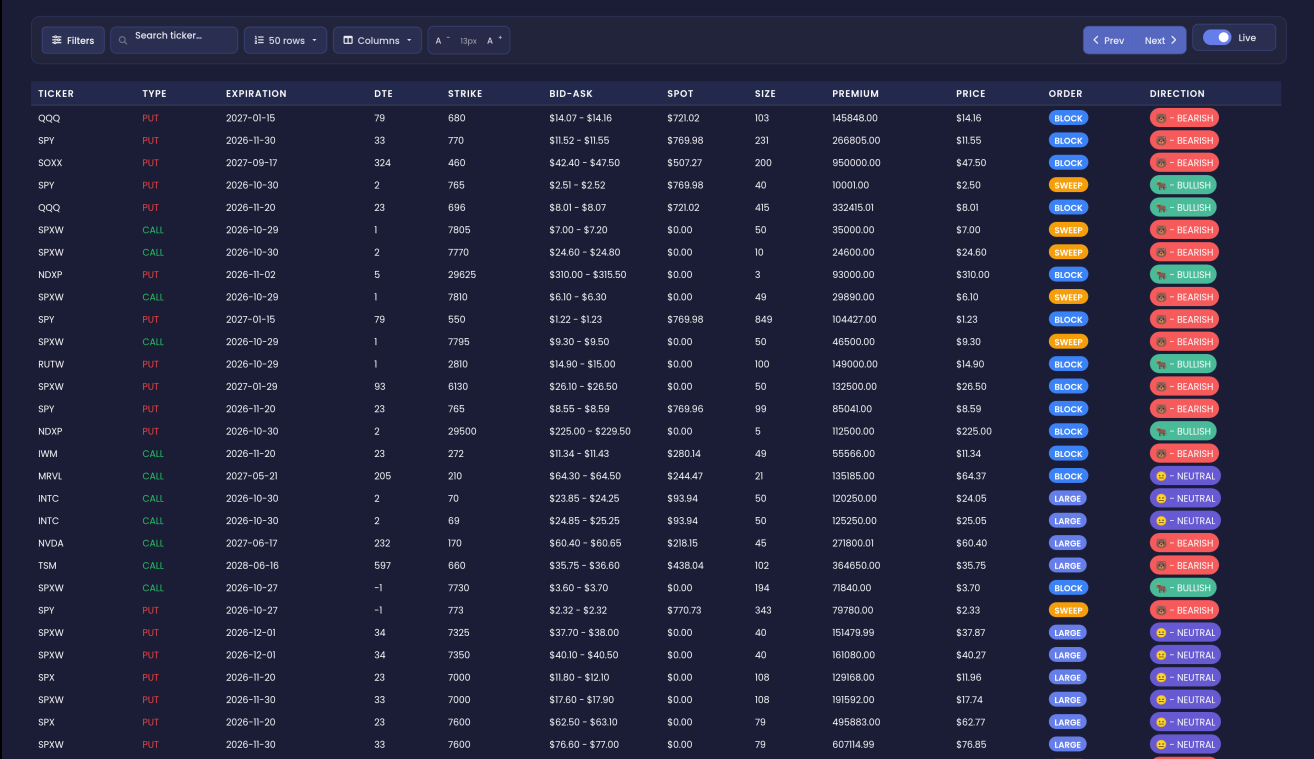
The largest flagged trade in the latest data is a SOXX 460 put block for +$950.0K, labeled BEARISH. Yet a QQQ 696 put block for +$332.4K reads BULLISH. Here is how to read every row, filter and label on the Unusual Activity tab.

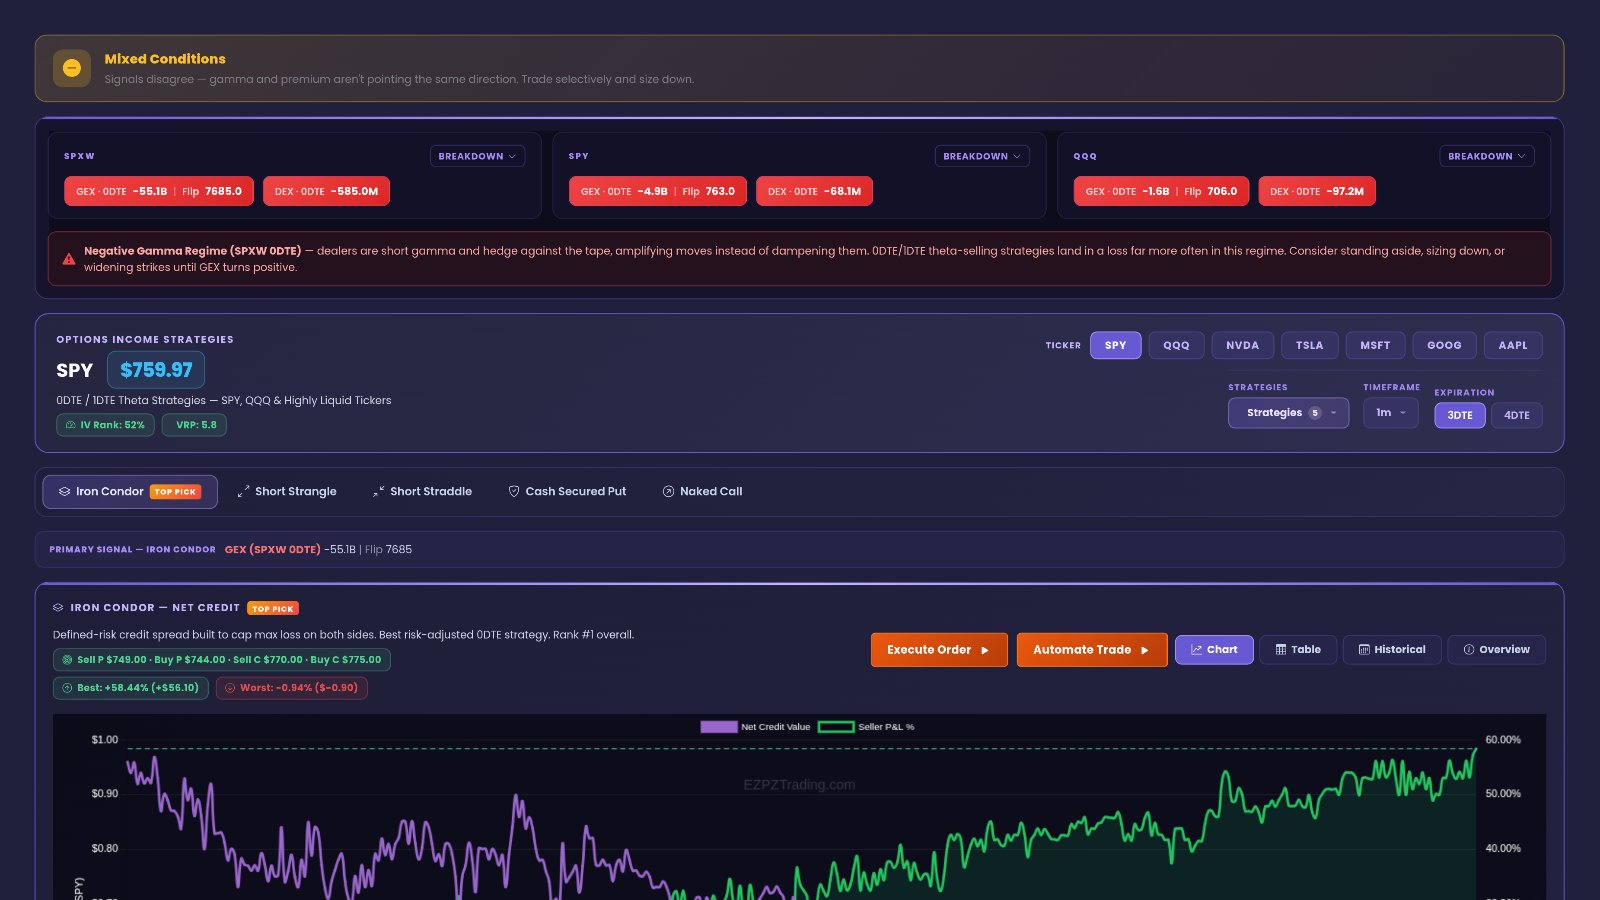
SPY sits at $759.97, below its 763.0 flip, and the banner reads Mixed Conditions. Meanwhile the top-ranked iron condor shows +$96 max profit, -$404 max loss and breakevens at $748.10 / $770.96. Here is how to read every part of the Theta Performance tab.
7-day free trial
Options flow, dark pool prints and AI market analysis on one dashboard. Try EZPZ Trading free for 7 days.