How to read the Expected Move table: DEM vs VEM price bands by expiration
SPY at $715.87: the 0DTE row shows a DEM move of ±$15.28 (band $700.59 to $731.15), a wider VEM move of 22.92 and an IVx of 61.18%. Here is how to read every column of the Expected Move tab.

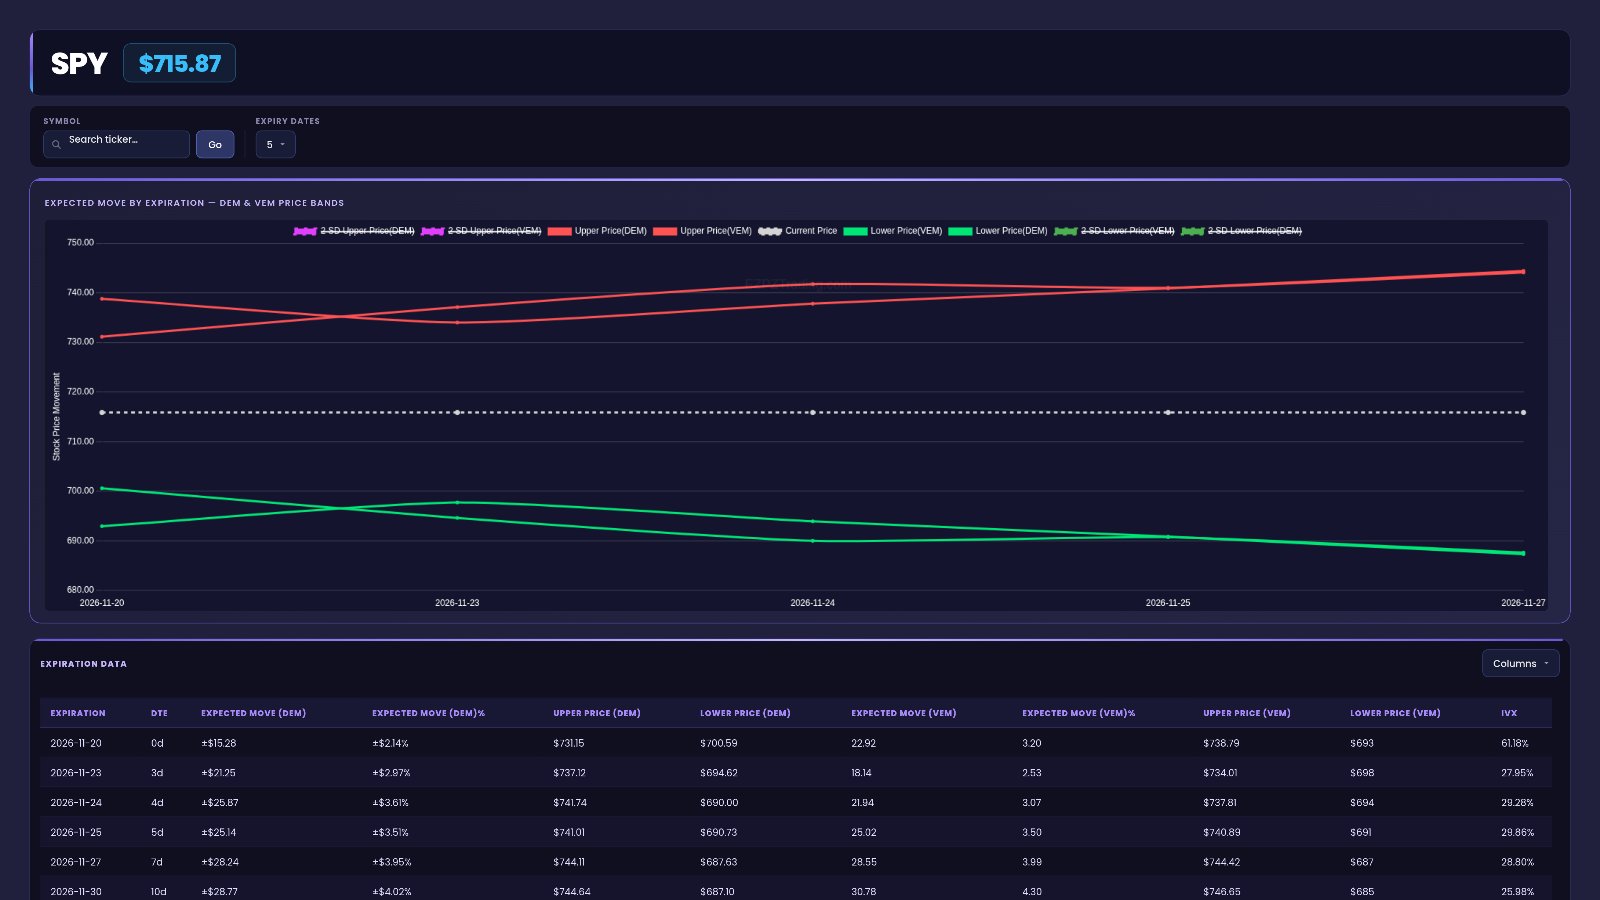
SPY sits at $715.87 in the latest data. On the nearest expiration (0d), the Expected Move tab shows a demand-based band of ±$15.28, from $700.59 up to $731.15. The volatility-based band on the same row is wider, and IVx reads 61.18%. That one row tells you how far the options market is pricing SPY to travel, and that two methods do not fully agree.
Quick definition first. An expected move is the price range the options market is pricing for a stock by a given expiration. DEM (Demand-Based Expected Move) reflects what option buyers and sellers are actually paying. VEM (IVx-based Expected Move) is the classic volatility version, using IVx and time to expiration. IVx is the implied volatility reading for that expiration. DTE means days to expiration. A 1 sigma range is the band the stock stays inside about 68% of the time. You can open the live Expected Move tab, or try the free delayed Expected Move page if you don't have an account.
$715.87
±$15.28
61.18%
The idea behind the Expected Move tab
Every option price carries a guess about how far the stock can move. The Expected Move tab turns that guess into plain price levels. For each expiration you get a dollar move, a percent move and an upper and lower price. You stop guessing what "elevated volatility" means and see real numbers instead.
Two lenses on the same question
The tab answers "how far might SPY move by this date?" in two ways. VEM is the standard volatility answer. DEM reflects real demand in the options market. EZPZ's method is proprietary. What matters to you is the comparison:
- DEM close to VEM: both lenses agree on the range. The 7d row is a good example: ±$28.24 versus 28.55.
- DEM narrower than VEM: demand prices a tighter range than volatility alone. On the 0d row, ±$15.28 DEM sits inside a 22.92 VEM move.
- DEM wider than VEM: demand prices more movement than volatility shows. On the 4d row, DEM is ±$25.87 and VEM is 21.94.
Why the bands get wider over time
More time means more room to move. So the band widens as you scroll down the table. SPY's DEM move grows from ±$15.28 at 0d to ±$28.24 at 7d. Further out, the 2026-12-18 row (28 DTE) shows a DEM move of 45.81 and a VEM move of 50.07. A wider band further out just reflects more time. It does not mean more urgency.
Why swing traders care
If you hold for a few days, the expected move gives you a reality check. A setup that needs SPY far outside the 1 sigma band by Friday is asking for an unusual move. A setup that sits well inside the band is asking for an ordinary one. It is a sizing and planning tool, not a call on direction.
Walking through the tab, top to bottom
The tab has three parts: the main expiration table, the definitions box and a filters button. Here they are in the order you see them.
EXPECTED MOVE BY EXPIRATION — DEM & VEM PRICE BANDS
This is the heart of the page. The table is labelled EXPIRATION DATA, with one row per upcoming expiration, nearest at the top. Here is every column as it appears on screen:
| Column | What it shows | How to read it |
|---|---|---|
| EXPIRATION | The option expiration date | Pick the date that matches your holding time. |
| DTE | Days to expiration, shown like "0d" or "7d" | 0d is the same-day expiration. Bigger numbers mean more time. |
| EXPECTED MOVE (DEM) | The demand-based move in dollars, shown with ± | How many dollars up or down the demand lens prices. |
| EXPECTED MOVE (DEM)% | The same move as a percent of price | Use it to compare tickers at different prices. |
| UPPER PRICE (DEM) | Top of the DEM band | The upper edge of the demand-based 1 sigma range. |
| LOWER PRICE (DEM) | Bottom of the DEM band | The lower edge of the demand-based 1 sigma range. |
| EXPECTED MOVE (VEM) | The volatility-based move in dollars | Compare it with the DEM move on the same row. |
| EXPECTED MOVE (VEM)% | The VEM move as a percent | Compare it with the DEM %. |
| UPPER PRICE (VEM) | Top of the VEM band | The upper edge of the volatility-based range. |
| LOWER PRICE (VEM) | Bottom of the VEM band | The lower edge of the volatility-based range. |
| IVX | Implied volatility for that expiration | Higher means the options are pricing bigger swings for that date. |
Reading the 0d row across. 2026-11-20, 0d. DEM move ±$15.28, or ±$2.14%. The DEM band runs from $700.59 to $731.15. The VEM move is 22.92, or 3.20, with a band from $693 to $738.79. IVx is 61.18%. So the volatility lens prices a wider range than the demand lens. And IVx on this row is far above the rows just after it.
Reading the 4d row across. 2026-11-24, 4d. DEM move ±$25.87 (±$3.61%), band $690.00 to $741.74. VEM move 21.94 (3.07), band $694 to $737.81. IVx 29.28%. Here it flips: DEM is the wider of the two.
Look for rows where the two lenses split sharply. On 2026-12-02 (12 DTE), DEM shows 12.28 while VEM shows 34.19. On 2027-02-26 (98 DTE), DEM shows 109.76 while VEM shows 81.84. A few rows show a DEM of 0.00 with both DEM prices at $715.87, such as 2026-12-03. Treat those rows as having no DEM band and read the VEM columns instead.
SPY IVx by expiration
The bars make the shape obvious. The nearest expiry stands far above everything else, then IVx drifts lower the further out you go. When near-dated IVx sits well above later dates, the market is pricing more movement right now than later.
DEFINITIONS
Below the table is a short glossary. It defines four terms:
- 1 Sigma EM: a 1 standard deviation move, about a 68% chance the stock stays inside that range.
- 2 Sigma EM: a 2 standard deviation move, about a 95% chance the stock stays inside that wider range.
- VEM (IVx-based Expected Move): a volatility-based expected move using IVx and time to expiration.
- DEM (Demand-Based Expected Move): an expected move that reflects real demand in the options market.
Keep the 68% figure in mind. The bands are not walls. About one time in three, price ends outside a 1 sigma band.
Filters
A filters button opens a small panel with six controls. Activity Type and Sentiment narrow what is shown by type and by bullish or bearish tilt. Start Date and End Date limit the date range. Min Value and Max Value set a floor and a ceiling on the values displayed. Leave them empty to see everything.
How to use the Expected Move tab on EZPZ: a 5-minute routine
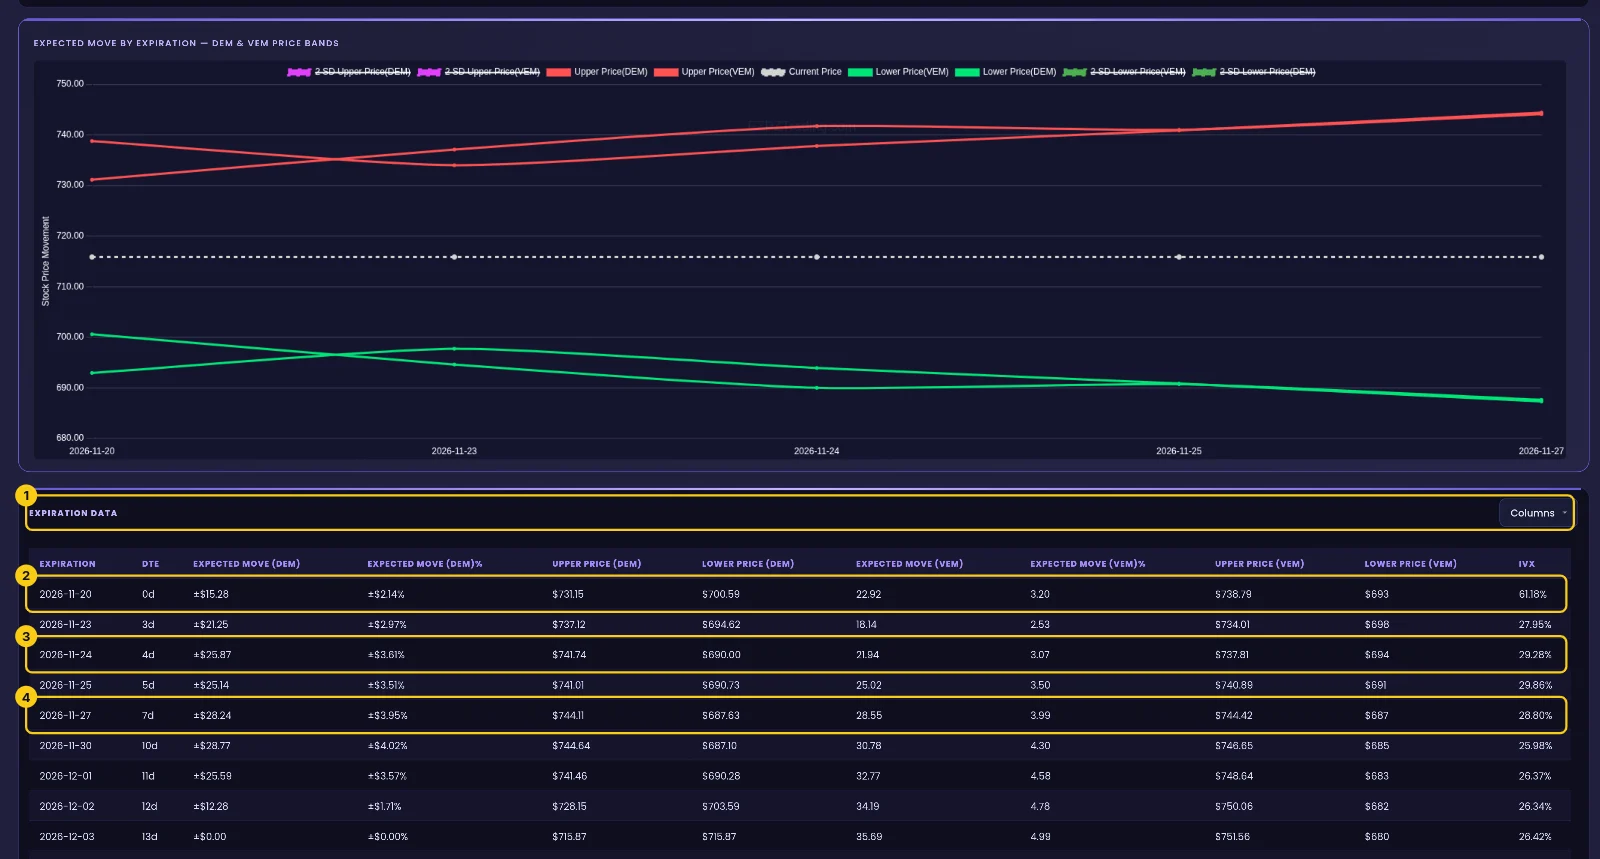
This is the exact routine, with the real screens from the latest data. The yellow numbers show where to look.
Read the nearest expirations first
Open the Expected Move tab and find the EXPIRATION DATA columns (1). Row (2) is the 0d expiry: DEM ±$15.28 (±$2.14%), band $700.59 to $731.15, VEM 22.92 and IVx 61.18%. Row (3) is 4d: DEM ±$25.87, band $690.00 to $741.74, IVx 29.28%. Row (4) is 7d: DEM ±$28.24 against VEM 28.55, band $687.63 to $744.11, IVx 28.80%, where the two lenses nearly match.
Check what the bands mean
Scroll to the DEFINITIONS box. Remind yourself that a 1 Sigma band holds price about 68% of the time and a 2 Sigma band about 95%. That keeps you from treating an upper price like $731.15 as a hard ceiling.

Match the row to your trade
Pick the expiration closest to how long you plan to hold. If you hold through 2026-11-27, read the 7d row. Ask whether your idea needs price outside that band or fits inside it. For same-day context, compare with the 0DTE Graph and the 7-DTE Graph.
Check again before the close
Expected moves shift as option prices change. Reopen the tab later and see whether the 0d DEM move or the IVx reading has changed. A big change in either is worth noting.
Reading the page in plain English
Put the columns together and each row reads like a sentence: "By this date, options price SPY between this low and this high, and the two methods agree or disagree."
- If DEM and VEM are close, as on the 7d row (±$28.24 vs 28.55), the page reads as both lenses agreeing on the range.
- If DEM is narrower than VEM, as on the 0d row (±$15.28 vs 22.92), the page reads as demand pricing a tighter range than volatility.
- If DEM is wider than VEM, as on the 4d row (±$25.87 vs 21.94), the page reads as demand pricing more movement than volatility shows.
- If near-dated IVx sits far above later rows, as with 61.18% at 0d versus 27.95% at 3d, the page reads as the market pricing more movement in the nearest expiry.
- If a row shows DEM at 0.00, the page reads as no DEM band for that date, so the VEM columns are the reading to use.
What this data cannot tell you
- Direction. The bands are symmetric around price. A ±$15.28 move says nothing about whether SPY goes up or down.
- Timing. The range is for the expiration date. It does not show when inside that window a move might happen.
- Certainty. A 1 sigma band holds about 68% of the time. Price can and does finish outside it.
Common mistakes
- Treating the band as a wall. The upper and lower prices are probability edges, not support and resistance.
- Reading the wrong row. A 0d range is far tighter than a 7d range. Match the expiration to your holding time.
- Ignoring the DEM vs VEM gap. When they split, like 12.28 vs 34.19 on 2026-12-02, the gap itself is information.
- Reading a 0.00 DEM as "no move expected". It means there is no DEM band on that row. Use the VEM columns.
- Comparing dollars across tickers. Use the % columns when you compare stocks at different prices.
Tools used in this post
These EZPZ tools pair well with the Expected Move tab when you plan around expirations.
Which plan you need
| Tool | Plan | Free delayed page |
|---|---|---|
| Expected Move | Pro | Yes |
| 0DTE Graph | Pro | Yes |
| 0DTE Speculation Map | Premium | Yes |
| 7-DTE Graph | Pro | Yes |
| Net Premium Heatmap | Pro | Yes |
| EZPZ Trifecta | Premium | None |
FAQ
What is the difference between DEM and VEM?
VEM is the volatility-based expected move, using IVx and time to expiration. DEM reflects real demand in the options market. EZPZ's method is proprietary. Comparing the two on one row is the main use of the tab.
What does the ± sign mean?
The move applies in both directions. A DEM move of ±$15.28 means the band runs that far above and below price, from $700.59 to $731.15 for SPY's 0d row.
How likely is SPY to stay inside the band?
The DEFINITIONS box says a 1 sigma band holds about 68% of the time. A 2 sigma band holds about 95% of the time.
Why is IVx so high on the nearest expiration?
The tab shows the reading, not the reason. On SPY, the 0d row shows 61.18% while the 3d row shows 27.95%. Read it as more movement priced into the nearest date.
Can I use this for earnings?
Yes, as a range check. See how we used expected moves in the earnings week cheat sheet and the NVDA earnings move post.