


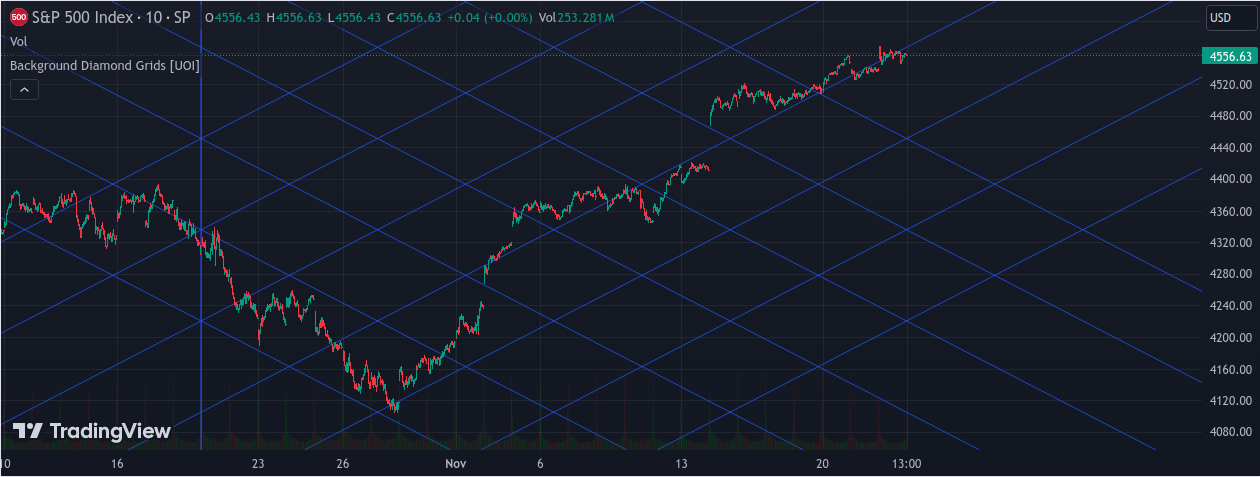
Horizontal and vertical lines can sometimes give the illusion of clear directional bias, which may mislead retail traders. In contrast, sophisticated algorithms and major market participants often rely on Fibonacci trend lines for more accurate and nuanced trading decisions. The Background Diamond Grids Indicator embraces this advanced approach to technical analysis, offering traders a powerful tool for identifying key trendlines and price levels within a specified historical data range.
Key Features:
Adjustable Historical Data Range: Choose the number of bars back to analyze, with options for both short-term and long-term analysis.
Customizable Grid Width: Adjust the width of the diamond grid to align with major Fibonacci trendlines in the chart.
Source Selection: Select the price source (e.g., close) for the analysis.
Trendline Detection: Use Auto Trend lines to automatically detect and draw Fibonacci-based trendlines, providing a more precise view of potential trend reversals and extensions.
The Background Diamond Grids Indicator offers a sophisticated approach to technical analysis, aligning with the strategies used by institutional and algorithmic traders. By focusing on Fibonacci trend lines instead of conventional horizontal and vertical lines, this indicator empowers traders to make more informed and accurate trading decisions.