


The Moving Average Crossover Strategy is a technical indicator designed to help retail investors identify potential buy and sell signals based on the crossover of two different moving averages. This strategy combines two sets of moving averages, 13 & 48 and 30 & 200, to provide more accurate signals for trading. Users can customize the length to any number such as 9 & 21 or any other pair that works for them.
This is a powerful tool for swing trading: Moving average crossover signals provide traders with a powerful tool for identifying potential shifts in market trends. These signals occur when shorter-term moving averages intersect longer-term ones, signaling a change in the prevailing price direction. This technique is particularly advantageous in volatile environments as it helps filter out short-term noise and provides a more reliable indication of a trend reversal. For swing traders, who aim to capture price movements over several days to weeks, these crossover signals offer a balanced approach. They offer the flexibility to respond to market changes while filtering out temporary fluctuations. This is particularly useful in volatile markets where sudden price spikes or drops can easily mislead traders. By focusing on more sustained changes indicated by moving average crossovers, swing traders can make more informed decisions and reduce the impact of market noise.
Features:
Show/Hide Moving Averages: Users can choose to display or hide the moving average lines (9 & 21, 13 & 48, 30 & 200, 50 and 100, and finally 50 and 200) on the chart. You can also manually enter your custom moving average number such as 21 over 55 (both Fibonacci numbers) instead of one of the existing pairs.
Show/Hide Fill between Moving Averages: Users can opt to visualize or hide the fill between the two moving averages.
Show/Hide Signals: Users can choose to display or hide signals of crossovers and crossunders on the chart.
Alert Conditions: Users can set alerts for 9x21, 13x48, 30x200, 50x100, and finally 50x200 crossovers and crossunders.
How to Use:
Settings and Options: Customize the settings according to your preference. You can choose to show or hide the moving averages, fill between moving averages, and signals. These settings are grouped into two categories: '13 X 48 Settings and Options' and '30 X 200 Settings and Options' and so on for the rest of the pairs.
Moving Averages: The default settings for the moving averages are 9 & 21, 13 & 48, 30 & 200, 50 and 100, and finally 50 and 200 but these can be customized according to your needs.
Signal Generation:
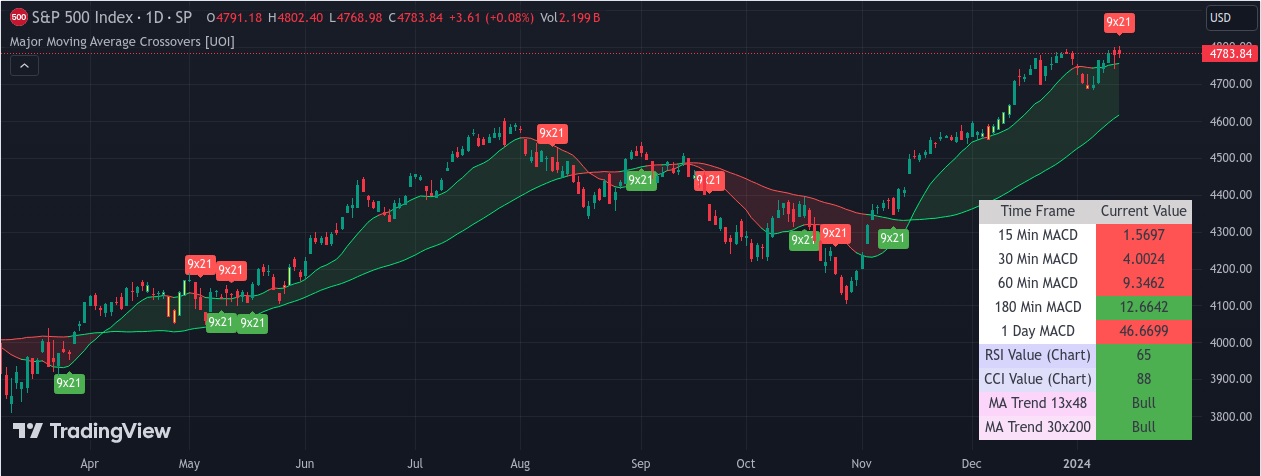
Buy Signal: A buy signal is generated when the fast moving average crosses above the slow moving average. This is represented by a green label '13x48' or '30x200' below the corresponding bar on the chart.
Sell Signal: A sell signal is generated when the fast moving average crosses below the slow moving average. This is represented by a red label 9x21, 13x48, 30x200, 50x100, and 50x200 above the corresponding bar on the chart.
Alerts: Set alerts to be notified of the 9x21, 13x48, 30x200, 50x100, and 50x200 crossovers and crossunders.
Interpretation:
When the 50-day moving average crosses above the 200-day moving average, it may be a good time to buy, Known as a Golden Cross.
Similarly, when the 50-day moving average crosses under the 200-day moving average, it may be a good time to sell, and vice known as a death cross.
Information Table:
This section of the code creates an information table on the chart to display the MACD, RSI, and CCI values for each timeframe, as well as the trend of multiple different moving averages (9x21, 13x48, 30x200, 50x100, and 50x200).
Optional Support and Resistance Lines
Users can enable optional support and resistance lines in the setting as well as choppiness yellow candles to avoid trades in choppy areas.
Timeframe MACD Crossover/crossunder Signals
The color coding MACD crossover crossunder signals can be turned on in the setting.
In a nutshell:
The Moving Average Crossover Strategy is a helpful tool for retail investors to identify potential entry and exit points. However, like all indicators, it should be used in conjunction with other indicators and analysis methods to confirm signals and avoid false positives. Always consider your risk tolerance and investment goals before making any trading decisions.
This is a powerful tool for swing trading: Moving average crossover signals provide traders with a powerful tool for identifying potential shifts in market trends. These signals occur when shorter-term moving averages intersect longer-term ones, signaling a change in the prevailing price direction. This technique is particularly advantageous in volatile environments as it helps filter out short-term noise and provides a more reliable indication of a trend reversal. For swing traders, who aim to capture price movements over several days to weeks, these crossover signals offer a balanced approach. They offer the flexibility to respond to market changes while filtering out temporary fluctuations. This is particularly useful in volatile markets where sudden price spikes or drops can easily mislead traders. By focusing on more sustained changes indicated by moving average crossovers, swing traders can make more informed decisions and reduce the impact of market noise.
Features:
Show/Hide Moving Averages: Users can choose to display or hide the moving average lines (9 & 21, 13 & 48, 30 & 200, 50 and 100, and finally 50 and 200) on the chart. You can also manually enter your custom moving average number such as 21 over 55 (both Fibonacci numbers) instead of one of the existing pairs.
Show/Hide Fill between Moving Averages: Users can opt to visualize or hide the fill between the two moving averages.
Show/Hide Signals: Users can choose to display or hide signals of crossovers and crossunders on the chart.
Alert Conditions: Users can set alerts for 9x21, 13x48, 30x200, 50x100, and finally 50x200 crossovers and crossunders.
How to Use:
Settings and Options: Customize the settings according to your preference. You can choose to show or hide the moving averages, fill between moving averages, and signals. These settings are grouped into two categories: '13 X 48 Settings and Options' and '30 X 200 Settings and Options' and so on for the rest of the pairs.
Moving Averages: The default settings for the moving averages are 9 & 21, 13 & 48, 30 & 200, 50 and 100, and finally 50 and 200 but these can be customized according to your needs.
Signal Generation:
Buy Signal: A buy signal is generated when the fast moving average crosses above the slow moving average. This is represented by a green label '13x48' or '30x200' below the corresponding bar on the chart.
Sell Signal: A sell signal is generated when the fast moving average crosses below the slow moving average. This is represented by a red label 9x21, 13x48, 30x200, 50x100, and 50x200 above the corresponding bar on the chart.
Alerts: Set alerts to be notified of the 9x21, 13x48, 30x200, 50x100, and 50x200 crossovers and crossunders.
Interpretation:
When the 50-day moving average crosses above the 200-day moving average, it may be a good time to buy, Known as a Golden Cross.
Similarly, when the 50-day moving average crosses under the 200-day moving average, it may be a good time to sell, and vice known as a death cross.
Information Table:
This section of the code creates an information table on the chart to display the MACD, RSI, and CCI values for each timeframe, as well as the trend of multiple different moving averages (9x21, 13x48, 30x200, 50x100, and 50x200).
Optional Support and Resistance Lines
Users can enable optional support and resistance lines in the setting as well as choppiness yellow candles to avoid trades in choppy areas.
Timeframe MACD Crossover/crossunder Signals
The color coding MACD crossover crossunder signals can be turned on in the setting.
In a nutshell:
The Moving Average Crossover Strategy is a helpful tool for retail investors to identify potential entry and exit points. However, like all indicators, it should be used in conjunction with other indicators and analysis methods to confirm signals and avoid false positives. Always consider your risk tolerance and investment goals before making any trading decisions.