


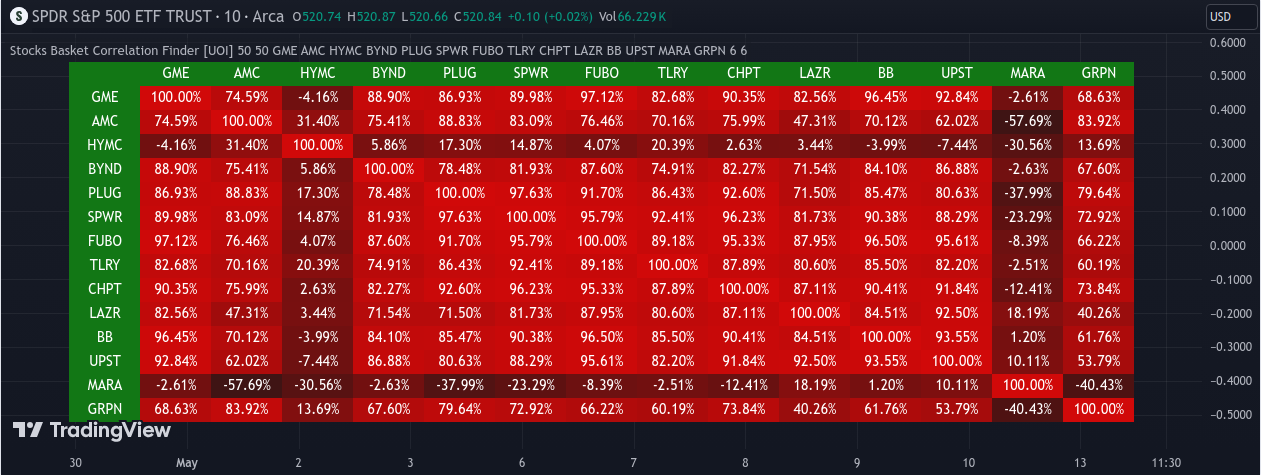
This indicator, called "Stocks Basket Correlation Finder," helps users identify the correlation between 14 different stock tickers (due to limited space). Users can change the tickers in settings to see how clusters of stocks move together on multiple time frames.
Here's how it works:
Users can set the "Correlation Length" to determine the number of bars back used to calculate correlation. This helps in analyzing historical correlation data. Two stocks might be correlated on a 1 minute timeframe but differ on a longer term timeframe.
The "Price Change Length" allows users to specify the number of bars back used to calculate the price change of the selected stocks. This is helpful for tracking changes over time.
Users can choose the time frame for analysis.
The indicator displays a heatmap that represents the correlation values between the selected stocks. The color of each cell in the heatmap corresponds to the strength of correlation between two stocks. A correlation closer to 1 indicates a strong positive correlation between two tickers or pairs, signifying that their price movements tend to move in the same direction.
Users can select the stocks they want to analyze by specifying their ticker symbols.
The indicator also provides options for customizing the appearance, such as cell size and color.
You can toggle between different color schemes for the heatmap that shows a gradient scheme.
The correlation values are rounded and displayed in the table, making it easy for users to interpret the results. This strong positive correlation suggests that there is a significant relationship between the two assets, and they tend to move in tandem.
Additionally, when calculating the price difference between two tickers or pairs, it is typically done by considering the closing prices of a specific time period, such as a daily chart. For instance, if you select a daily chart, the price difference is calculated based on the closing price of each day. This means that at the end of each trading day, the closing prices of the two assets are compared to determine their price difference. This approach provides a snapshot of how the assets performed during that particular trading day and helps in assessing their correlation over time.
In summary, this indicator helps users visualize and analyze how a group of 14 stocks move together over time, allowing them to identify patterns and correlations between the selected assets.