


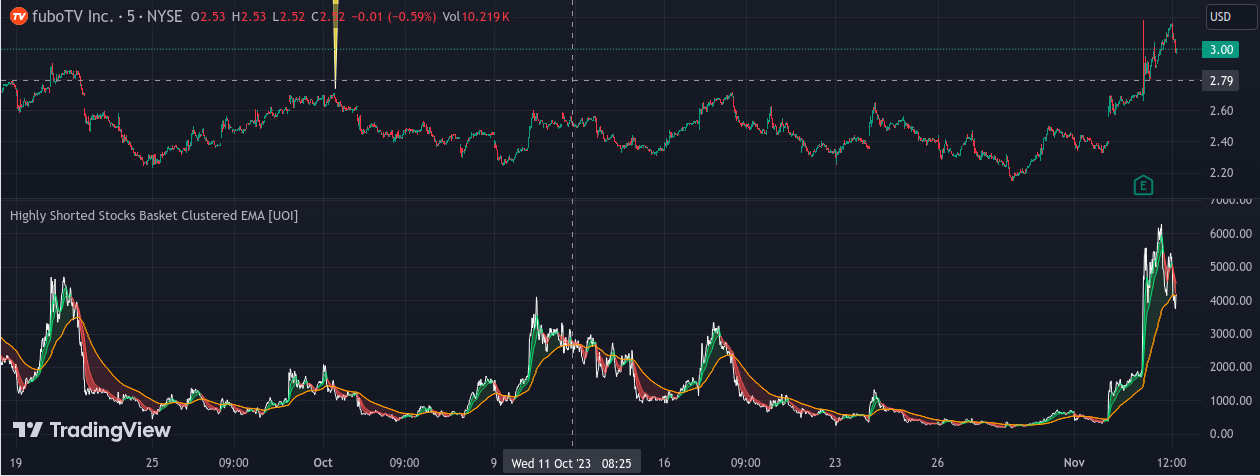
This indicator, named "Highly Shorted Stocks Basket Clustered EMA," is designed to assist users in analyzing a cluster of 20 different stock tickers (preferably chose tickers that move together and are strongly correlated). It allows users to observe how these stocks move collectively over time by calculating various exponential moving averages (EMAs).
Here's a breakdown of its features:
- Ticker Selection: Users can select up to 20 different stock tickers of their choice for analysis. The indicator provides a list of ticker symbols for customization.
- Price Cluster Visualization: The indicator plots a clustered price line, representing the collective price movements of the selected stocks. This provides an overview of how these stocks perform together.
- Exponential Moving Averages (EMAs): The indicator calculates multiple EMAs, including a long EMA, a short EMA, and an extra-long EMA. These moving averages help users identify trends and potential reversals in the collective price data.
- Customizable EMAs: Users can customize the length of the short EMA and extra-long EMA according to their preferences. This flexibility allows for tailored analysis.
- Fill Visualization: The indicator uses fills to highlight the relationship between the short EMA and long EMA, as well as between the long EMA and extra-long EMA. The fill colors change based on the relative positions of these moving averages, aiding in trend analysis.
- EMA Extra Long: An additional EMA, referred to as the "EMA Extra Long," is calculated and displayed in orange on the chart. This EMA provides insights into longer-term trends within the cluster of stocks.
In summary, this indicator empowers users to gain insights into the performance and trends of a selected group of 20 stocks. It offers customizable EMAs and visualizations to assist users in making informed trading decisions based on the collective price movements of these stocks.