


This script is a financial indicator that displays the percentage difference between the closing prices of two groups of stocks: small to mid-cap stocks and mega-cap stocks. Here’s a simple breakdown of how this indicator functions:
1. Objective: The aim of this indicator is to analyze market breadth or overall market health. It does this by comparing the performance of smaller, mid-sized companies to that of very large (mega-cap) companies, helping investors and traders make well-informed decisions.
2. Daily Chart Exclusivity: This indicator is specifically configured to operate on daily charts. This signifies that it takes into account the daily closing prices of the specified stock groups for its calculations and analyses.
3. Percentage Difference: At its core, this indicator calculates the percentage difference in the closing prices of the small to mid-cap stocks against the mega-cap stocks. This calculation reveals the comparative performance of the two groups, helping to gauge which group is outperforming the other.
4. Exponential Moving Averages (EMAs): The indicator includes two EMAs—one that reacts more quickly and another more gradual one. EMAs, giving more emphasis to recent prices, are instrumental in identifying trending directions and gauging momentum.
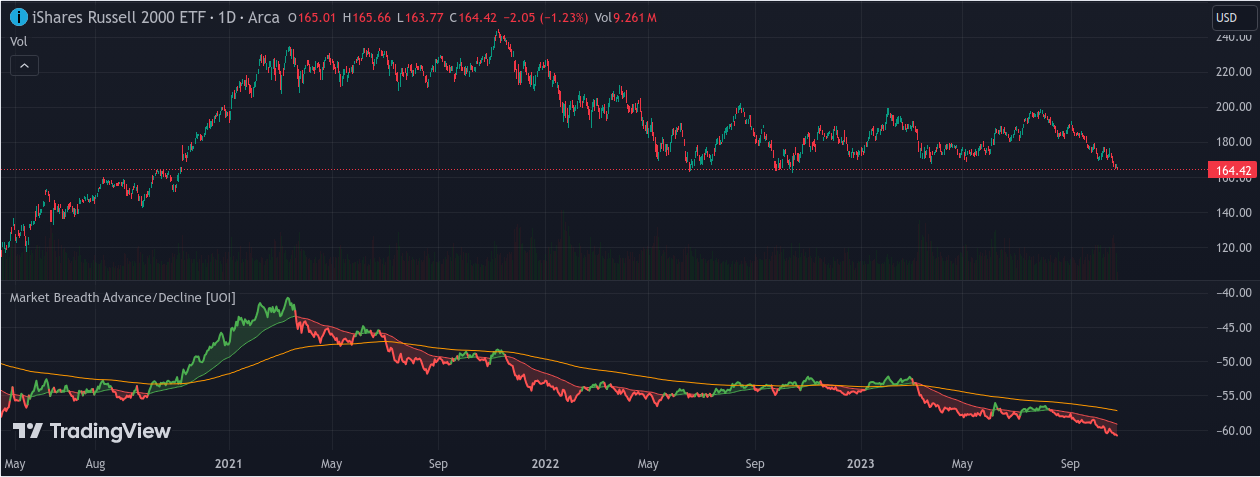
5. Visual Components:
- The computed percentage difference is represented visually, employing a color scheme where green denotes higher values relative to the fast EMA, and red denotes lower values.
- The fast EMA is also depicted using color variations, influenced by its comparative value to the percentage difference.
- A colored fill between the plots of the percentage difference and the fast EMA assists in enhancing visual interpretability, assisting in the clear discernment of trend characteristics.
In essence, this indicator offers a visual representation of the performance disparity between smaller/mid-sized companies and mega-cap companies, aiding in understanding prevailing market trends and the broader market’s health. It is crucial to note that this tool is precisely devised for utilization with daily charts.
1. Objective: The aim of this indicator is to analyze market breadth or overall market health. It does this by comparing the performance of smaller, mid-sized companies to that of very large (mega-cap) companies, helping investors and traders make well-informed decisions.
2. Daily Chart Exclusivity: This indicator is specifically configured to operate on daily charts. This signifies that it takes into account the daily closing prices of the specified stock groups for its calculations and analyses.
3. Percentage Difference: At its core, this indicator calculates the percentage difference in the closing prices of the small to mid-cap stocks against the mega-cap stocks. This calculation reveals the comparative performance of the two groups, helping to gauge which group is outperforming the other.
4. Exponential Moving Averages (EMAs): The indicator includes two EMAs—one that reacts more quickly and another more gradual one. EMAs, giving more emphasis to recent prices, are instrumental in identifying trending directions and gauging momentum.
5. Visual Components:
- The computed percentage difference is represented visually, employing a color scheme where green denotes higher values relative to the fast EMA, and red denotes lower values.
- The fast EMA is also depicted using color variations, influenced by its comparative value to the percentage difference.
- A colored fill between the plots of the percentage difference and the fast EMA assists in enhancing visual interpretability, assisting in the clear discernment of trend characteristics.
In essence, this indicator offers a visual representation of the performance disparity between smaller/mid-sized companies and mega-cap companies, aiding in understanding prevailing market trends and the broader market’s health. It is crucial to note that this tool is precisely devised for utilization with daily charts.