


The McClellan Market Breadth Indicator is a powerful tool for traders and analysts designed to reveal changes in market sentiment and the strength of market trends. This indicator combines the advanced-decline data from both the New York Stock Exchange (NYSE) and NASDAQ to provide a comprehensive view of market breadth. It does so by calculating the net advances, the difference between advancing issues and declining issues, and then smoothing the data with an Exponential Moving Average (EMA).
By including data from both NYSE and NASDAQ, the indicator offers a more robust representation of the overall market sentiment, capturing the dynamics of a broader range of securities.
Key Features of the McClellan Market Breadth Indicator:
- Market Breadth Analysis: The McClellan Oscillator component of the indicator uses the smoothed difference between advancing and declining issues to gauge the undercurrents of market movement, providing insights that are not easily visible from price action alone.
- Trend Strength Assessment: The indicator employs an EMA of the oscillator itself to assess the momentum and strength of the trend. This dual-layer smoothing helps in identifying the underlying market direction more reliably.
- Divergence Signals: Traders watch for divergences between the index price and the oscillator, as these can signal potential reversals. For example, if the index is rising but the oscillator is falling, it may warn of a future decline in the index. Conversely, if the index is falling and the oscillator is rising, an upcoming rally might be indicated.
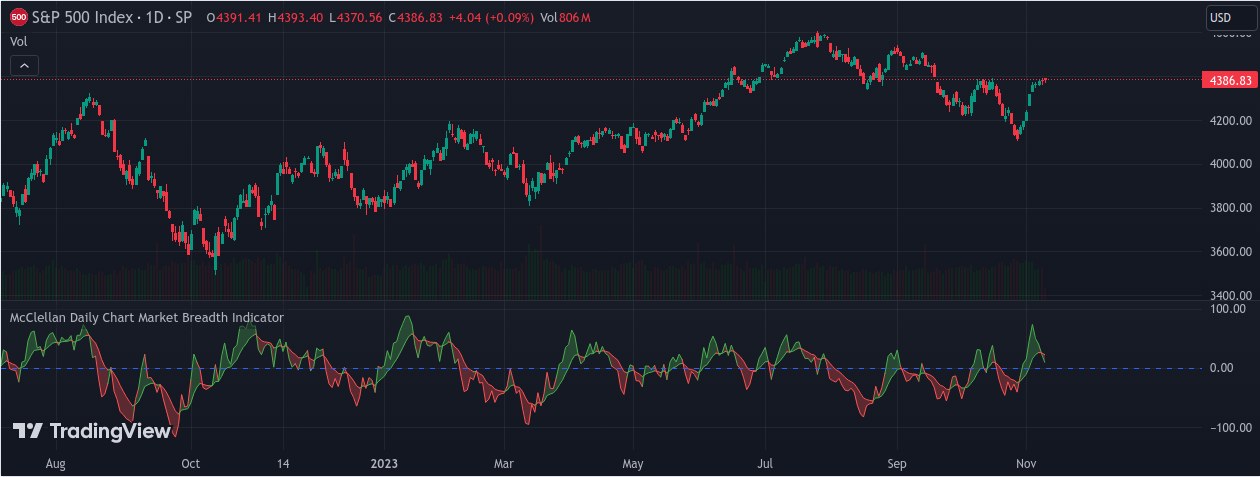
- Breadth Thrust Identification: A significant swing in the oscillator, such as a 100 point move from negative to positive, is termed a breadth thrust. This suggests a potent shift in market sentiment, potentially indicating a reversal from a downtrend to an uptrend. Special attention needs to be paid to 0 line.
The indicator is versatile and can be applied to any stock exchange or group of stocks to confirm the rise or fall of an index. Readings above zero confirm an upward trend, while readings below zero indicate a downward trend. The addition of a fill color between the oscillator and its EMA—with green indicating the EMA is below the oscillator (bullish sentiment) and red indicating the EMA is above the oscillator (bearish sentiment)—provides a visual representation of these shifts with 80% transparency for clear analysis.
With its comprehensive approach to measuring market breadth and trend strength, the McClellan Daily Chart Market Breadth Indicator is a valuable addition to the trader's toolkit, offering actionable insights into market dynamics.
By including data from both NYSE and NASDAQ, the indicator offers a more robust representation of the overall market sentiment, capturing the dynamics of a broader range of securities.
Key Features of the McClellan Market Breadth Indicator:
- Market Breadth Analysis: The McClellan Oscillator component of the indicator uses the smoothed difference between advancing and declining issues to gauge the undercurrents of market movement, providing insights that are not easily visible from price action alone.
- Trend Strength Assessment: The indicator employs an EMA of the oscillator itself to assess the momentum and strength of the trend. This dual-layer smoothing helps in identifying the underlying market direction more reliably.
- Divergence Signals: Traders watch for divergences between the index price and the oscillator, as these can signal potential reversals. For example, if the index is rising but the oscillator is falling, it may warn of a future decline in the index. Conversely, if the index is falling and the oscillator is rising, an upcoming rally might be indicated.
- Breadth Thrust Identification: A significant swing in the oscillator, such as a 100 point move from negative to positive, is termed a breadth thrust. This suggests a potent shift in market sentiment, potentially indicating a reversal from a downtrend to an uptrend. Special attention needs to be paid to 0 line.
The indicator is versatile and can be applied to any stock exchange or group of stocks to confirm the rise or fall of an index. Readings above zero confirm an upward trend, while readings below zero indicate a downward trend. The addition of a fill color between the oscillator and its EMA—with green indicating the EMA is below the oscillator (bullish sentiment) and red indicating the EMA is above the oscillator (bearish sentiment)—provides a visual representation of these shifts with 80% transparency for clear analysis.
With its comprehensive approach to measuring market breadth and trend strength, the McClellan Daily Chart Market Breadth Indicator is a valuable addition to the trader's toolkit, offering actionable insights into market dynamics.