


Top SPY Movers and Shakers Clustered EMA
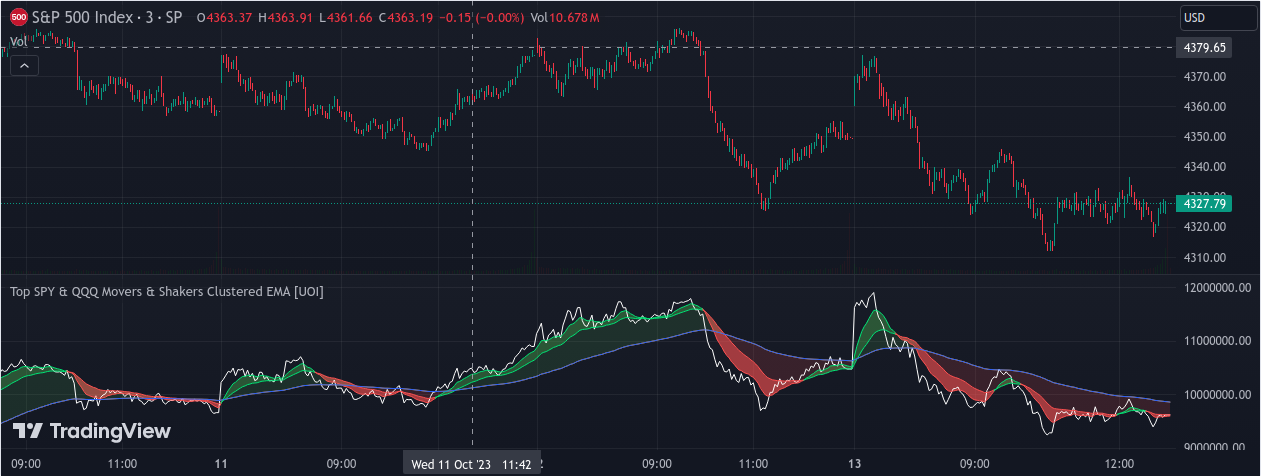
The "Top SPY Movers Clustered EMA" indicator provides a unique perspective on the aggregated performance of selected mega-cap stocks through a combined price line, while also offering insights on its momentum through two Exponential Moving Averages (EMAs).
Features:
Clustered Price Line: The main line, called "Clustered Price", represents the product of the closing prices of the thirteen selected mega-cap stocks. This line gives a cumulative view of their combined performance. Users can customize the color of this line through the settings.
Exponential Moving Averages (EMAs): The indicator plots two EMAs – a short-term EMA and a long-term EMA – based on the clustered price. These EMAs can be used to identify potential trend directions and crossovers.
Short EMA: Calculated over a default period of 9 days (customizable).
Long EMA: Calculated over a default period of 21 days (customizable).
The area between the two EMAs is filled to visually represent their relative positions. The fill is green when the short EMA is above the long EMA, indicating bullish momentum. Conversely, the fill is red when the short EMA is below the long EMA, indicating bearish momentum.
Usage:
The relative positions of the short and long EMAs can be used to identify potential buy or sell signals. A crossover of the short EMA above the long EMA might be considered bullish, while a crossover below could be seen as bearish.
The clustered price line offers a consolidated view of the selected stocks, providing an understanding of their combined influence and direction.
Customization:
Users have the flexibility to:
Choose the mega-cap stocks they want to track.
Adjust the periods of the short and long EMAs.
Customize the color of the clustered price line.