


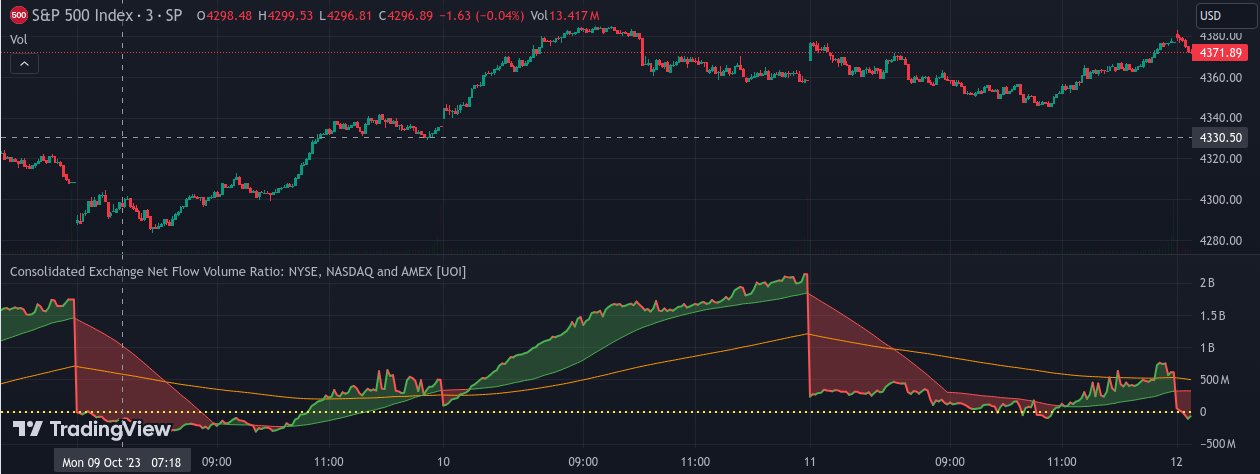
The "Consolidated Exchange Net Flow Volume Ratio: NYSE, NASDAQ and AMEX " is a comprehensive indicator crafted to offer traders an integrated perspective on the net flow volume ratios from three key exchanges: NYSE, NASDAQ, and AMEX. By pooling the positive and negative volume data from NYSE, NASDAQ, and AMEX the indicator produces a unified net flow volume RATIO, capturing the aggregate sentiment across the exchanges.
Visually, the consolidated net flow volume is represented with a line whose color shifts based on the direction of movement. Additionally, the indicator computes a 50-period Simple Moving Average (SMA) for this combined data, which can be essential for spotting overarching market trends. Not stopping there, a 200-period Exponential Moving Average (EMA) is also provided, further enriching the analytical depth.
To assist in visual differentiation and facilitate quicker interpretations, areas between the consolidated net flow volume and the SMA are filled with color, hinting at prevailing market momentum. Whether you are a seasoned trader or a beginner, this consolidated view paves the way for a holistic understanding of volume trends, facilitating data-driven decisions in ever-evolving markets.
Additionally the center line zero is plotted with A YELLOW dotted line to show the ratio better.