


This indicator analyzes the performance of various sectors within the SPY, taking into account their respective weights in the SPY's market cap. It retrieves the closing prices of different sectors and calculates whether each sector has advanced or declined compared to the previous bar. It then weights these advances and declines based on the input weights representing each sector's contribution to the SPY's market cap. the think MA line represents the moving average of the weighted sectors.
It also has an unweighted sector advance decline line (the thin line).
Ideally you should use this on a one or three minute chart if you are trading options or scalping.
The script offers several adjustable parameters including:
The length of the accumulated Hull Moving Average (HMA) which is used to smooth the Advance/Decline line. (Lower numbers are more sensitive)
The length of the weighted and unweighted sectors moving averages. (lower numbers are more predictive but fast changing)
The market cap weightings of different sectors in the SPY, which are used to calculate the weighted advance and decline.
The script computes two main outputs:
A weighted Advance/Decline line, where the advance or decline of each sector is weighted based on its market cap in the SPY.
An unweighted Advance/Decline line, where the advance or decline of each sector is weighted equally.
A moving average of the weighted and unweighted Advance/Decline line.
The script then plots the following:
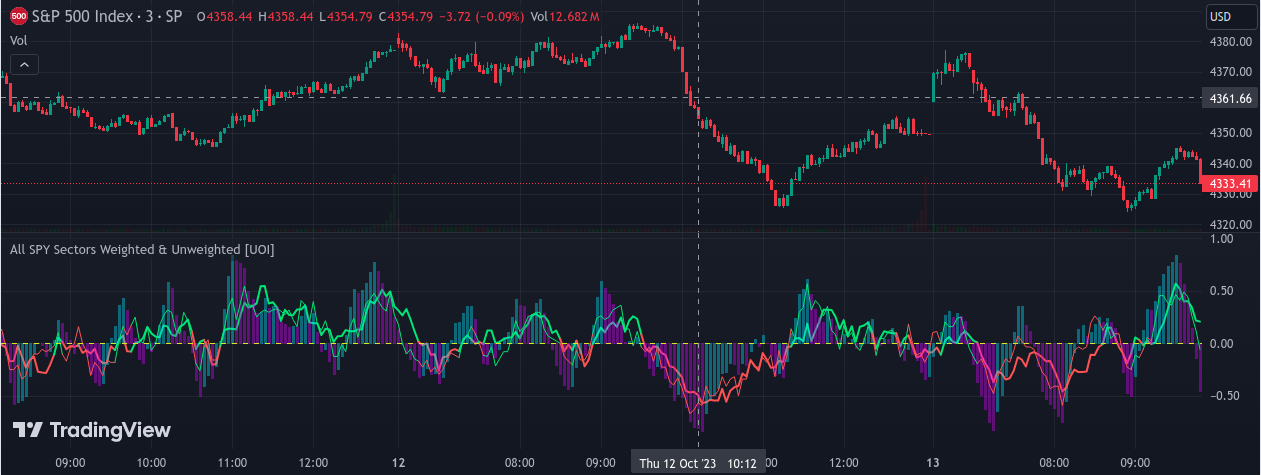
The Hull Moving Average of the weighted Advance/Decline line, plotted as a histogram where the color indicates the direction of movement (blue for an advance and purple for a decline).
The weighted and unweighted moving average of the Advance/Decline line, with the color indicating the direction of movement (green for an advance and red for a decline).
This indicator can be a valuable tool for traders looking to analyze the broader market trends and the performance of individual sectors within the SPY.
It also has an unweighted sector advance decline line (the thin line).
Ideally you should use this on a one or three minute chart if you are trading options or scalping.
The script offers several adjustable parameters including:
The length of the accumulated Hull Moving Average (HMA) which is used to smooth the Advance/Decline line. (Lower numbers are more sensitive)
The length of the weighted and unweighted sectors moving averages. (lower numbers are more predictive but fast changing)
The market cap weightings of different sectors in the SPY, which are used to calculate the weighted advance and decline.
The script computes two main outputs:
A weighted Advance/Decline line, where the advance or decline of each sector is weighted based on its market cap in the SPY.
An unweighted Advance/Decline line, where the advance or decline of each sector is weighted equally.
A moving average of the weighted and unweighted Advance/Decline line.
The script then plots the following:
The Hull Moving Average of the weighted Advance/Decline line, plotted as a histogram where the color indicates the direction of movement (blue for an advance and purple for a decline).
The weighted and unweighted moving average of the Advance/Decline line, with the color indicating the direction of movement (green for an advance and red for a decline).
This indicator can be a valuable tool for traders looking to analyze the broader market trends and the performance of individual sectors within the SPY.