


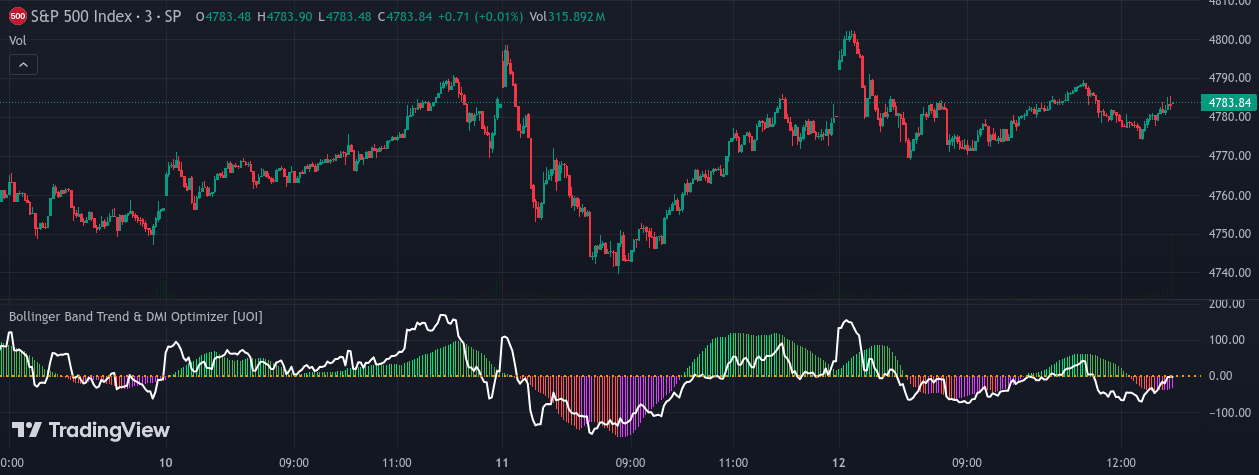
This Bollinger Band trends Optimizer, facilitates the comparison of short and long period Bollinger Bands, enhancing trend detection by calculating and plotting the absolute differences between the bands. The script features customizable inputs for periods and standard deviations, and it visualizes trends with dynamic color-coding based on their increasing or decreasing nature relative to a zero line. Unique to this script is a refined BB Trend calculation that contrasts the middle lines of short and long BB periods, complete with alert conditions for pivotal trend reversals, making it a potent tool for traders analyzing volatility and price patterns.
This enhanced version of the Bollinger Band Trends Optimizer now includes an integration with the Directional Movement Index (DMI), further enriching its analytical capabilities. The addition of DMI allows users to assess trend direction and strength alongside Bollinger Band metrics. Customizable settings for DMI include adjustable length, optional display of the DMI line with distinct colors for values above and below zero, and the choice to show crossover triangles as visual signals for trend reversals. These crossover triangles, which can be colored differently for positive and negative crossovers, provide intuitive and quick insights into trend changes. This blend of Bollinger Band analysis with DMI elements creates a robust tool for traders focusing on volatility, trend strength, and directional movement in market prices.
IMPORTANT: IMPORTANT: IMPORTANT: IMPORTANT: IMPORTANT:
If the histogram bars (BB Trend) or DMI line don't display properly (for instance, if one is too small or not sufficiently visible), you can adjust this in the settings by increasing the size of the DMI or BB Trend through multiplication. The line colors (above zero or below zero) can be changed in the setting.