


The "Algorganic Trend Optimizer I " is primarily based on the Price, Volume and Trend.
If we attempt to compress the algorithmic concepts present in this indicator into a single line, we could express it as follows:
PVT = ∑ ((Ct / Ct-1) - 1) * Vt
In this equation:
PVT is the Price Volume Trend.
Ct represents the closing price at time t.
Ct-1 represents the closing price at time t-1.
Vt is the volume at time t.
The sum (∑) operates over the entire data series.
The simple moving average (SMA) or exponential moving average (EMA) of the PVT is then calculated over a period defined by the user. A "signal" is considered to have occurred when the PVT crosses the SMA or EMA, triggering a buy or sell alert represented in a crossover and color change.
This technical indicator enhances a trader's decision-making process by generating buy and sell alerts based on the crossover of the PVT and a user-selected smoothed signal line.
This momentum indicator, incorporates both the volume and price action to give a comprehensive view of the market's direction. It is calculated by taking the percentage change in price from one period to another and multiplying it by the volume of the current period. The PVT is then smoothed using either an SMA or EMA with a user-defined length. The SMA gives equal weighting to all points in the set, while the EMA gives more weight to recent prices: PVT = ∑ ((Ct / Ct-1) - 1) * Vt
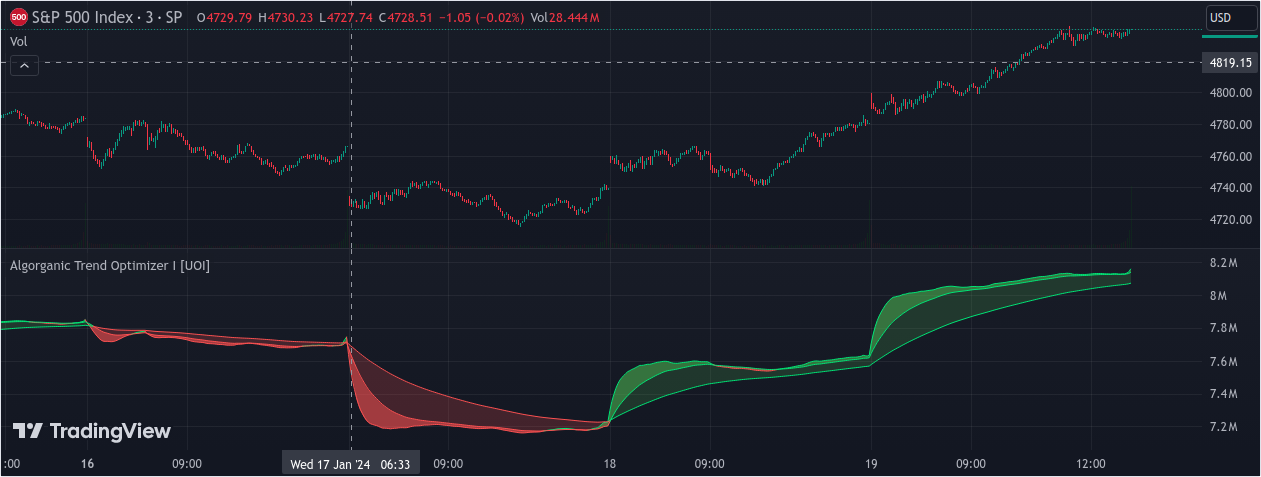
This indicator allows the user to visualize the PVT and its smoothed line on a chart, with an optional feature to fill the gap area between these two lines. It uses color coding for intuitive visual feedback: a green color indicates when the PVT is above the smoothed signal, and red indicates when the PVT is below the signal.
When the PVT crosses above the smoothed line, a buy alert is triggered, and when the PVT crosses below the smoothed line, a sell alert is triggered. These alerts provide real-time actionable insights for traders, helping them to time their trades based on the trend changes signaled by the PVT and its interaction with the smoothed line.
If we attempt to compress the algorithmic concepts present in this indicator into a single line, we could express it as follows:
PVT = ∑ ((Ct / Ct-1) - 1) * Vt
In this equation:
PVT is the Price Volume Trend.
Ct represents the closing price at time t.
Ct-1 represents the closing price at time t-1.
Vt is the volume at time t.
The sum (∑) operates over the entire data series.
The simple moving average (SMA) or exponential moving average (EMA) of the PVT is then calculated over a period defined by the user. A "signal" is considered to have occurred when the PVT crosses the SMA or EMA, triggering a buy or sell alert represented in a crossover and color change.
This technical indicator enhances a trader's decision-making process by generating buy and sell alerts based on the crossover of the PVT and a user-selected smoothed signal line.
This momentum indicator, incorporates both the volume and price action to give a comprehensive view of the market's direction. It is calculated by taking the percentage change in price from one period to another and multiplying it by the volume of the current period. The PVT is then smoothed using either an SMA or EMA with a user-defined length. The SMA gives equal weighting to all points in the set, while the EMA gives more weight to recent prices: PVT = ∑ ((Ct / Ct-1) - 1) * Vt
This indicator allows the user to visualize the PVT and its smoothed line on a chart, with an optional feature to fill the gap area between these two lines. It uses color coding for intuitive visual feedback: a green color indicates when the PVT is above the smoothed signal, and red indicates when the PVT is below the signal.
When the PVT crosses above the smoothed line, a buy alert is triggered, and when the PVT crosses below the smoothed line, a sell alert is triggered. These alerts provide real-time actionable insights for traders, helping them to time their trades based on the trend changes signaled by the PVT and its interaction with the smoothed line.