


The "Clustered Put to Call Ratio (All equities & indices) " indicator is a tool designed to provide insights into market sentiment. It analyzes data related to put and call options and presents it in an easy-to-understand format. It works better on longer timeframe such as 15 minutes, one hour and daily.
Imagine this indicator as a weather forecast for the financial markets. It helps traders and investors gauge whether the market is leaning towards bullish (positive) or bearish (negative) sentiment.
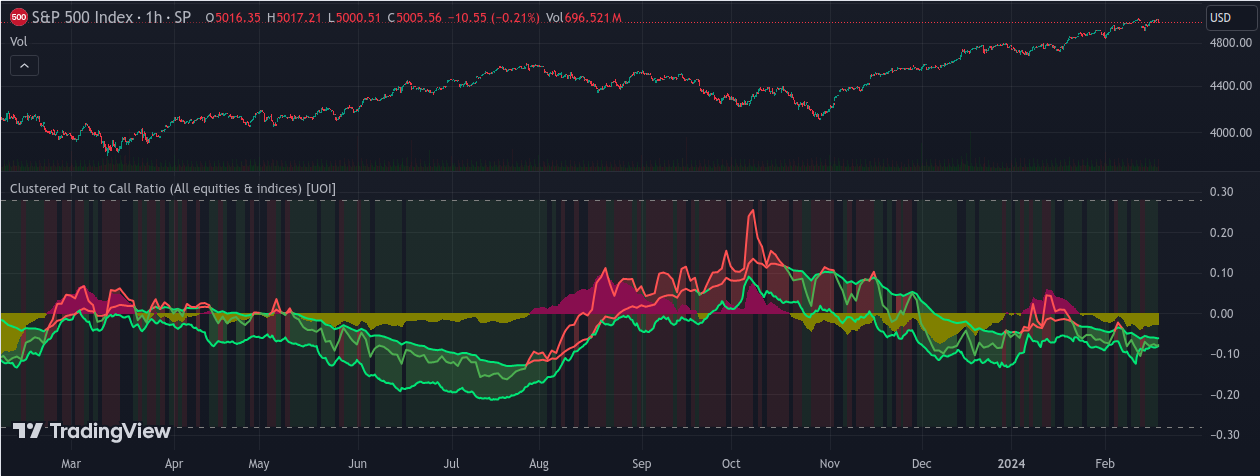
The main component of this indicator is a histogram that visually represents changes in the Put Call Ratio (PCR). When the histogram is above a certain level, it indicates a more bearish sentiment, and when it's below that level, it suggests a more bullish sentiment.
Additionally, the indicator uses color coding to highlight different market conditions. For example, it may use green when the sentiment is positive and red when it's negative.
The indicator also incorporates moving averages to provide a smoother view of market sentiment trends. It's like looking at a moving average of weather conditions to get a clearer picture of whether it's getting sunnier or cloudier.
This indicator is a valuable tool for traders and investors, helping them make more informed decisions by providing insights into market sentiment and trends. Just like a weather forecast, it offers a glimpse into what might be ahead in the financial markets.
Imagine this indicator as a weather forecast for the financial markets. It helps traders and investors gauge whether the market is leaning towards bullish (positive) or bearish (negative) sentiment.
The main component of this indicator is a histogram that visually represents changes in the Put Call Ratio (PCR). When the histogram is above a certain level, it indicates a more bearish sentiment, and when it's below that level, it suggests a more bullish sentiment.
Additionally, the indicator uses color coding to highlight different market conditions. For example, it may use green when the sentiment is positive and red when it's negative.
The indicator also incorporates moving averages to provide a smoother view of market sentiment trends. It's like looking at a moving average of weather conditions to get a clearer picture of whether it's getting sunnier or cloudier.
This indicator is a valuable tool for traders and investors, helping them make more informed decisions by providing insights into market sentiment and trends. Just like a weather forecast, it offers a glimpse into what might be ahead in the financial markets.