


Volatility stands at the heart of options trading strategies. The intricate decision of opting for a long straddle versus a short straddle, or venturing into the realms of strangles, is fundamentally driven by an understanding of market volatility. Accurately gauging this volatility is crucial, as it directly influences the potential for profit and the risk of loss in options trading. By equipping traders with the insights to navigate through volatile markets, the right tools can significantly enhance the decision-making process, guiding strategies that align with current market dynamics.
This advanced trading tool is meticulously crafted for traders seeking to leverage the dynamics of moving averages to navigate the complexities of market trends. By integrating the Directional Movement Index (DMI) with the Average True Range (ATR), the indicator offers an unparalleled clarity into both the momentum and volatility of the market, enabling users to discern the strength and direction of trends with precision.
Components:
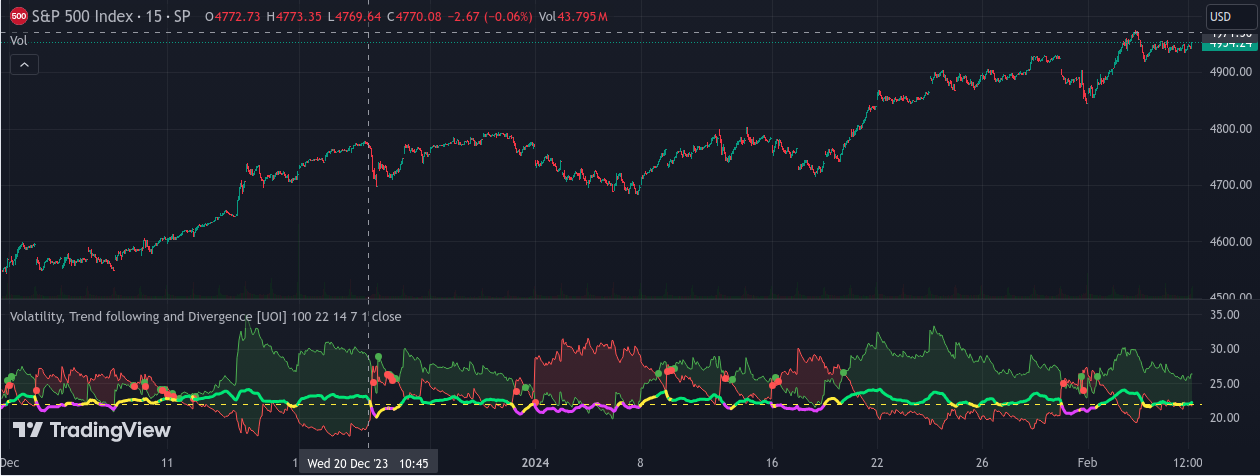
Adjusted Bull DMI (Green Line): A refined representation of positive directional movement, this line is pivotal in identifying the emergence and endurance of bullish market trends. Its smoothed nature enhances the reliability of trend strength assessments.
Adjusted Bear DMI (Red Line): Analogous to its bullish counterpart, this line delineates smoothed negative directional movement, serving as a critical indicator of bearish trend momentum. Its presence and position are integral to understanding market downturns.
Average True Range: This component quantifies market volatility by averaging the true range over a selected period. It's instrumental in gauging the intensity of price fluctuations, providing insights into market conditions' stability or turbulence.
Threshold Line (Yellow Line): Positioned as a benchmark, this horizontal line offers a reference against which the DMI lines' positions are evaluated, aiding in the interpretation of trend strength and directionality.
Usage and Interpretation:
Trend Direction: The indicator signals a bullish market condition when the green line ascends above the red line, and conversely, a bearish trend is suggested when the red line overtakes the green line.
Trend Strength: By examining the gap between the green and red lines, traders can infer the trend's robustness. A substantial separation indicates a potent trend, offering a clearer signal for decision-making.
Signal Generation:
Bullish Signal: A bullish market signal is generated as the green line breaches both the red line and the threshold, highlighting potential upward momentum.
Bearish Signal: Conversely, a bearish signal is triggered when the red line descends below both the green line and the threshold, signaling downward movement.
Visual Aids:
The shading between the DMI lines visually encapsulates the trend's direction, with green representing bullish momentum and red indicating bearish movements. This graphical representation simplifies trend identification at a glance.
Indicator points marked with green circles signify positive crossovers, suggesting bullish entry points, whereas red circles denote negative crossovers, signaling potential exits or bearish entries.
Customization:
The indicator offers adjustable parameters, including the calculation period length and the threshold level, allowing users to tailor the sensitivity and responsiveness of the tool to align with their trading strategy or market outlook. This customization capability ensures that the indicator remains versatile across different market conditions and personal trading preferences.
This advanced trading tool is meticulously crafted for traders seeking to leverage the dynamics of moving averages to navigate the complexities of market trends. By integrating the Directional Movement Index (DMI) with the Average True Range (ATR), the indicator offers an unparalleled clarity into both the momentum and volatility of the market, enabling users to discern the strength and direction of trends with precision.
Components:
Adjusted Bull DMI (Green Line): A refined representation of positive directional movement, this line is pivotal in identifying the emergence and endurance of bullish market trends. Its smoothed nature enhances the reliability of trend strength assessments.
Adjusted Bear DMI (Red Line): Analogous to its bullish counterpart, this line delineates smoothed negative directional movement, serving as a critical indicator of bearish trend momentum. Its presence and position are integral to understanding market downturns.
Average True Range: This component quantifies market volatility by averaging the true range over a selected period. It's instrumental in gauging the intensity of price fluctuations, providing insights into market conditions' stability or turbulence.
Threshold Line (Yellow Line): Positioned as a benchmark, this horizontal line offers a reference against which the DMI lines' positions are evaluated, aiding in the interpretation of trend strength and directionality.
Usage and Interpretation:
Trend Direction: The indicator signals a bullish market condition when the green line ascends above the red line, and conversely, a bearish trend is suggested when the red line overtakes the green line.
Trend Strength: By examining the gap between the green and red lines, traders can infer the trend's robustness. A substantial separation indicates a potent trend, offering a clearer signal for decision-making.
Signal Generation:
Bullish Signal: A bullish market signal is generated as the green line breaches both the red line and the threshold, highlighting potential upward momentum.
Bearish Signal: Conversely, a bearish signal is triggered when the red line descends below both the green line and the threshold, signaling downward movement.
Visual Aids:
The shading between the DMI lines visually encapsulates the trend's direction, with green representing bullish momentum and red indicating bearish movements. This graphical representation simplifies trend identification at a glance.
Indicator points marked with green circles signify positive crossovers, suggesting bullish entry points, whereas red circles denote negative crossovers, signaling potential exits or bearish entries.
Customization:
The indicator offers adjustable parameters, including the calculation period length and the threshold level, allowing users to tailor the sensitivity and responsiveness of the tool to align with their trading strategy or market outlook. This customization capability ensures that the indicator remains versatile across different market conditions and personal trading preferences.