


The Operationalized Relative Volume Flow indicator offers a detailed analysis of trading volume by comparing current activity against historical averages over a user-defined period. This tool is designed to enhance traders' understanding of market liquidity and participant behavior by focusing on relative volume—a measure that indicates how current trading volume stacks up to a specified average volume from the past.
Core Mechanics:
Relative Volume Calculation: At its essence, the indicator calculates relative volume by taking the current volume and comparing it to the average volume over a period specified by the user (from 2 to 100 bars). This comparison yields a percentage that signifies whether the current volume is above or below the norm for that period, offering insights into the intensity of trading activity.
EMA of Relative Volume: To identify trends and smooth out short-term fluctuations in volume, the indicator applies an Exponential Moving Average (EMA) to the relative volume data. Users can adjust the EMA period for finer control over the trend analysis.
Visualization and Customization: Through user inputs, the appearance of the EMA line (color and thickness) can be customized, allowing for clear visual differentiation on charts. Additionally, the indicator plots a histogram to visually represent relative volume changes over time, with color coding to distinguish between bullish and bearish volume activity.
Informative Labels: A distinctive feature is the dynamic label that combines the EMA value of relative volume with the average relative volume percentage over the selected period. This label, whose position can be offset for better visibility, changes color based on the relationship between the two metrics—indicating bullish, bearish, or divergent volume conditions at a glance.
The value of using relative volume lies in its ability to highlight discrepancies between current and typical market activity. For traders, such discrepancies can signal opportunities where the market is preparing to move, potentially ahead of visible price changes. By quantifying how current volume compares to historical norms, the Operationalized Relative Volume indicator aids in identifying moments of unusual market activity, which could precede significant price movements.
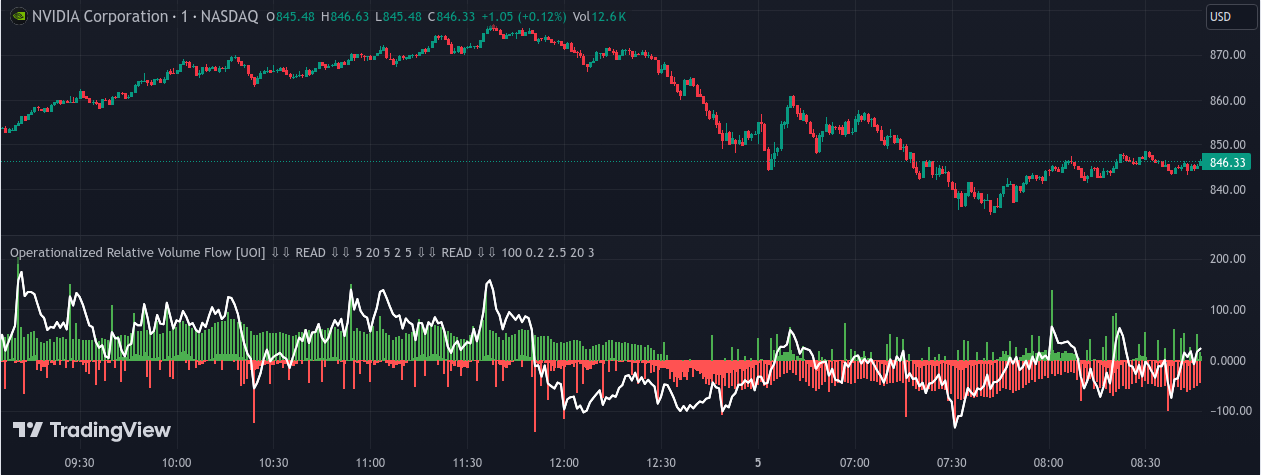
Additionally, this indicator integrates logarithmic price changes with volume, applying a dynamic cutoff based on volatility to discern significant market movements. An innovative aspect is the inclusion of a columns multiplier, empowering users to adjust the visual impact of histogram bars representing the volume flow - magnifying or minimizing them for clearer analysis. The volume flow is further smoothed by a selectable moving average (MA), with an additional Exponential Moving Average (EMA) providing a signal line to identify trend divergences. Histogram bars dynamically change color to illustrate volume flow momentum, turning green for positive flow and red for negative, offering intuitive visual cues for market sentiment. The script encapsulates a blend of volume analysis and price action, yielding an indicator that highlights volume-driven market dynamics through customizable, visually engaging histograms and trend lines.
This indicator is suitable for traders interested in leveraging volume analysis to refine their market entry and exit strategies, offering a deeper layer of insight into market dynamics beyond what traditional volume indicators provide.
Core Mechanics:
Relative Volume Calculation: At its essence, the indicator calculates relative volume by taking the current volume and comparing it to the average volume over a period specified by the user (from 2 to 100 bars). This comparison yields a percentage that signifies whether the current volume is above or below the norm for that period, offering insights into the intensity of trading activity.
EMA of Relative Volume: To identify trends and smooth out short-term fluctuations in volume, the indicator applies an Exponential Moving Average (EMA) to the relative volume data. Users can adjust the EMA period for finer control over the trend analysis.
Visualization and Customization: Through user inputs, the appearance of the EMA line (color and thickness) can be customized, allowing for clear visual differentiation on charts. Additionally, the indicator plots a histogram to visually represent relative volume changes over time, with color coding to distinguish between bullish and bearish volume activity.
Informative Labels: A distinctive feature is the dynamic label that combines the EMA value of relative volume with the average relative volume percentage over the selected period. This label, whose position can be offset for better visibility, changes color based on the relationship between the two metrics—indicating bullish, bearish, or divergent volume conditions at a glance.
The value of using relative volume lies in its ability to highlight discrepancies between current and typical market activity. For traders, such discrepancies can signal opportunities where the market is preparing to move, potentially ahead of visible price changes. By quantifying how current volume compares to historical norms, the Operationalized Relative Volume indicator aids in identifying moments of unusual market activity, which could precede significant price movements.
Additionally, this indicator integrates logarithmic price changes with volume, applying a dynamic cutoff based on volatility to discern significant market movements. An innovative aspect is the inclusion of a columns multiplier, empowering users to adjust the visual impact of histogram bars representing the volume flow - magnifying or minimizing them for clearer analysis. The volume flow is further smoothed by a selectable moving average (MA), with an additional Exponential Moving Average (EMA) providing a signal line to identify trend divergences. Histogram bars dynamically change color to illustrate volume flow momentum, turning green for positive flow and red for negative, offering intuitive visual cues for market sentiment. The script encapsulates a blend of volume analysis and price action, yielding an indicator that highlights volume-driven market dynamics through customizable, visually engaging histograms and trend lines.
This indicator is suitable for traders interested in leveraging volume analysis to refine their market entry and exit strategies, offering a deeper layer of insight into market dynamics beyond what traditional volume indicators provide.