


The "Algorganic Typical Price Channel Trade Optimizer II" is a trading indicator designed to signal potential buy and sell points based on various levels of overbought and oversold conditions. This is achieved by plotting a series of lines that represent different calculated values and their relative positions.
This formula represents the indicator:
Buy_Signal, Sell_Signal = crossover(EMA((ap - EMA(ap, n1)) / (0.015 * EMA(abs(ap - EMA(ap, n1)), n1)), n2), 0), crossunder(SMA(EMA((ap - EMA(ap, n1)) / (0.015 * EMA(abs(ap - EMA(ap, n1)), n1)), n2), 10), 0)
Where:
ap = (High + Low + Close) / 3
n1 = Channel Length (user input)
n2 = Average Length (user input)
This indicator starts by getting two user inputs: 'Channel Length' (default value of 21) and 'Average Length' (default value of 34). These lengths will be used to calculate the different parts of the indicator. It also gets inputs for 'Ultra Over Bought', 'Over Bought', 'Ultra Over Sold', and 'Over Sold' levels.
Next, it calculates an intermediate term, which is the Exponential Moving Average (EMA) of the 'typical price' (which is the average of the high, low, and close prices), over the period defined by the 'Channel Length'. This intermediate term, hereafter referred to as 'Smoothed Typical Price', essentially smoothens out the price data.
Then, it calculates 'Mean Deviation', which is another EMA of the absolute differences between the 'typical price' and 'Smoothed Typical Price'. This measures the volatility or the average amount the price deviates from the 'Smoothed Typical Price'.
These calculations lead us to the main component of the indicator, 'Commodity Channel Index', which measures the difference between the 'typical price' and its moving average, normalized by 'Mean Deviation'. In other words, it measures how far the price has deviated from its average trend.
'Trend Commodity Index' is an EMA of 'Commodity Channel Index' over the 'Average Length'. Two lines are then plotted, one being 'Trend Commodity Index' itself (Trend Line 1) and the other a Simple Moving Average (SMA) of 'Trend Commodity Index' over 10 periods (Trend Line 2).
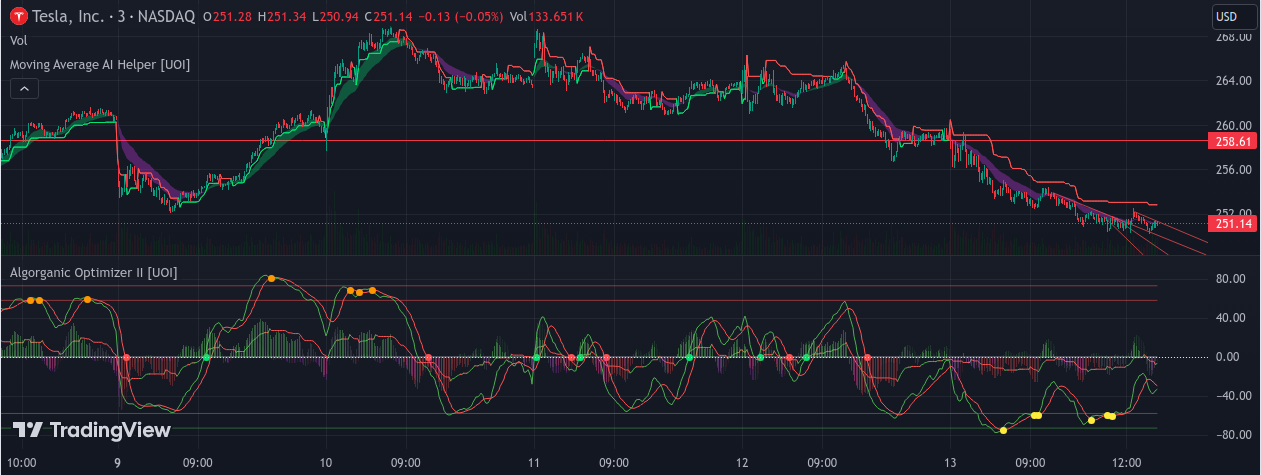
The red and green circles are generated when these lines cross and of importance is particularly when they cross the zero level. When 'Trend Line 1' crosses above zero, it signals a potential buy opportunity or continuation. When 'Trend Line 2' crosses below zero, it signals a potential sell opportunity or continuation. But the cross overs (just like MACD) signify a change is the typical price channel that help traders make a better decision when the buy signal on the chart is issued.
The indicator then plots horizontal lines for 'Ultra Over Bought', 'Over Bought', 'Ultra Over Sold', and 'Over Sold' levels, and these serve as thresholds to identify potential reversals.
The final part of the indicator involves plotting the difference between 'Trend Line 1' and 'Trend Line 2' as columns, which are color-coded based on whether the difference is increasing or decreasing and whether it is above or below zero.
In summary, this indicator is a great trading indicator that generates potential buy and sell signals based on overbought and oversold conditions, as well as changes in the price trend.
This formula represents the indicator:
Buy_Signal, Sell_Signal = crossover(EMA((ap - EMA(ap, n1)) / (0.015 * EMA(abs(ap - EMA(ap, n1)), n1)), n2), 0), crossunder(SMA(EMA((ap - EMA(ap, n1)) / (0.015 * EMA(abs(ap - EMA(ap, n1)), n1)), n2), 10), 0)
Where:
ap = (High + Low + Close) / 3
n1 = Channel Length (user input)
n2 = Average Length (user input)
This indicator starts by getting two user inputs: 'Channel Length' (default value of 21) and 'Average Length' (default value of 34). These lengths will be used to calculate the different parts of the indicator. It also gets inputs for 'Ultra Over Bought', 'Over Bought', 'Ultra Over Sold', and 'Over Sold' levels.
Next, it calculates an intermediate term, which is the Exponential Moving Average (EMA) of the 'typical price' (which is the average of the high, low, and close prices), over the period defined by the 'Channel Length'. This intermediate term, hereafter referred to as 'Smoothed Typical Price', essentially smoothens out the price data.
Then, it calculates 'Mean Deviation', which is another EMA of the absolute differences between the 'typical price' and 'Smoothed Typical Price'. This measures the volatility or the average amount the price deviates from the 'Smoothed Typical Price'.
These calculations lead us to the main component of the indicator, 'Commodity Channel Index', which measures the difference between the 'typical price' and its moving average, normalized by 'Mean Deviation'. In other words, it measures how far the price has deviated from its average trend.
'Trend Commodity Index' is an EMA of 'Commodity Channel Index' over the 'Average Length'. Two lines are then plotted, one being 'Trend Commodity Index' itself (Trend Line 1) and the other a Simple Moving Average (SMA) of 'Trend Commodity Index' over 10 periods (Trend Line 2).
The red and green circles are generated when these lines cross and of importance is particularly when they cross the zero level. When 'Trend Line 1' crosses above zero, it signals a potential buy opportunity or continuation. When 'Trend Line 2' crosses below zero, it signals a potential sell opportunity or continuation. But the cross overs (just like MACD) signify a change is the typical price channel that help traders make a better decision when the buy signal on the chart is issued.
The indicator then plots horizontal lines for 'Ultra Over Bought', 'Over Bought', 'Ultra Over Sold', and 'Over Sold' levels, and these serve as thresholds to identify potential reversals.
The final part of the indicator involves plotting the difference between 'Trend Line 1' and 'Trend Line 2' as columns, which are color-coded based on whether the difference is increasing or decreasing and whether it is above or below zero.
In summary, this indicator is a great trading indicator that generates potential buy and sell signals based on overbought and oversold conditions, as well as changes in the price trend.