


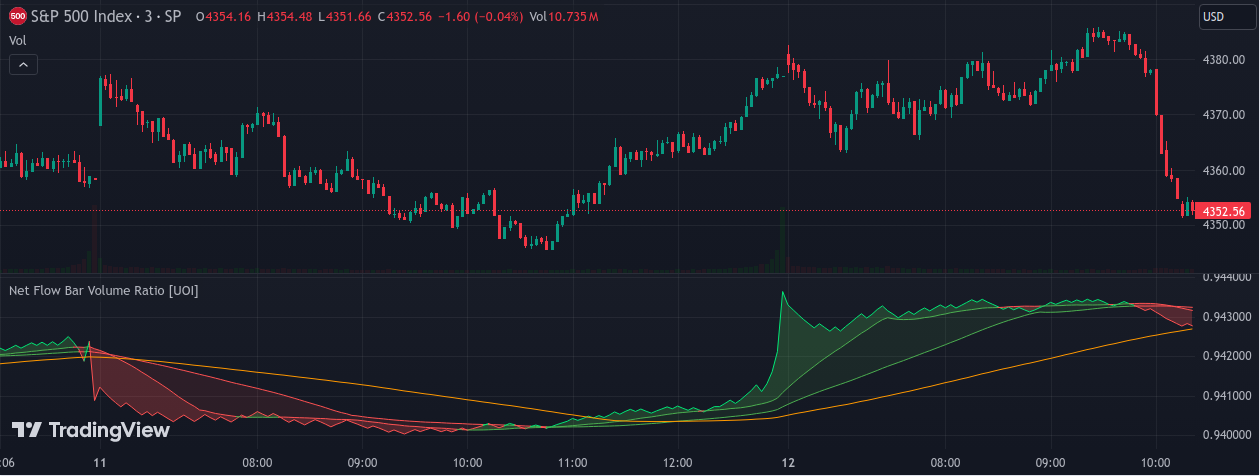
This technical analysis indicator, "Net Flow Bar Volume Ratio", provides an insightful visual representation of the volume flow dynamics by calculating the ratio of up-net-volume to down-net-volume for a given financial instrument on a weekly basis. The higher the ratio, the stronger the upward trend; conversely, the lower the ratio, the stronger the downward trend.
Key components of the indicator are:
- Net Flow Volume Ratio (net volume Ratio): This is calculated by dividing the sum of the weekly up-net-volume (volume traded when closing price is higher than the opening price) by the down-net-volume (volume traded when closing price is lower than the opening price).
- Bollinger Bands: This component includes three lines - Basis (SMA of net volume Ratio), Upper and Lower bands. The Basis is calculated as a Simple Moving Average (SMA) of the net volume Ratio over a user-defined length. The Upper and Lower bands are calculated by adding and subtracting a user-defined multiplier of the standard deviation of the net volume Ratio from the Basis respectively. The area between the Upper and Lower bands is filled with a semi-transparent blue color, providing a visual representation of the volatility of the net volume Ratio.
Users can adjust the length of the SMA and the multiplier for the standard deviation in the Bollinger Bands, and the offset for all three lines, allowing for customization based on individual trading strategy and style.
This indicator is helpful for traders looking to understand volume-based trading dynamics. By interpreting the volume Ratio and its volatility as represented by the Bollinger Bands, a trader can make educated predictions about potential reversals or continuations of the current trend and thereby identify potential trading opportunities.